
Figures & data
Table 1 Clinical profile of the subjects
Table 2 Changes of the intraocular pressure and intraocular pressure reduction rate (percentage ± standard deviation) after switching to dorzolamide/timolol fixed combination
Figure 1 Mean deviation (MD) before and after switching to dorzolamide/timolol (1%/0.5%) fixed combination.
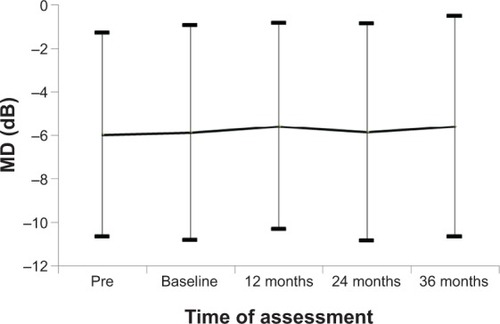
Figure 2 Annual change of mean deviation (MD slope) during the 1 year before switching to dorzolamide/timolol (1%/0.5%) fixed combination (Pre), from baseline to 12 months after switching (12 months), 12–24 months after switching (12–24 months), and 24–36 months after switching (36 months) in all patients.
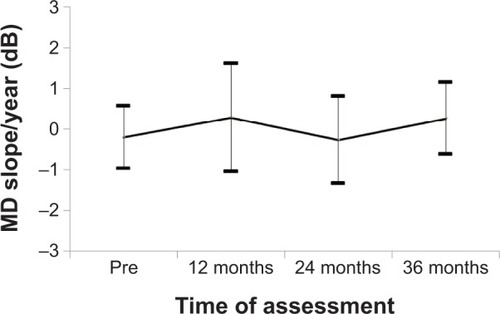
Figure 3 Pattern standard deviation (PSD) and foveal sensitivity before and after switching to dorzolamide/timolol (1%/0.5%) fixed combination. Mean values after switching to dorzolamide/timolol (1%/0.5%) fixed combination were compared with baseline values (P<0.05; *paired one-tailed Student’s t-test).
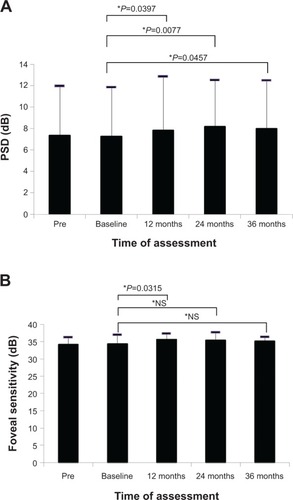
Figure 4 Scatter plot with regression line for the relation between the mean deviation (MD) slope (dB/year) during 1 year before switching to dorzolamide/timolol (1%/0.5%) fixed combination (Pre-MD slope) and the mean MD slope for 3 years after switching (Post-MD slope).
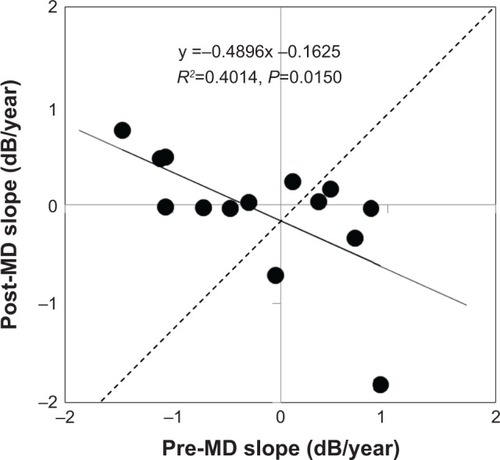
Table 3 Correlations among the MD and MD slope before and after switching to DTFC
Figure 5 Scatter plots and regression lines for the association between the mean deviation (MD) slope for 3 years after switching (Post-MD slope) and the intraocular pressure (IOP) reduction rate at 3 years after switching to dorzolamide/timolol (1%/0.5%) fixed combination (A) and the mean IOP reduction rate for 3 years after switching to dorzolamide/timolol (1%/0.5%) fixed combination (B).
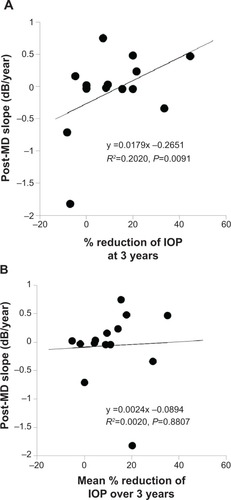
Table 4 Correlations between the MD slope for 3 years after switching and various factors, as well as multivariate odds ratios for the MD slope for 3 years (n=14)
Table 5 Comparison of IOP- and MD-related parameters between patients with and without progression of visual field loss
Table 6 Correlations between progression of visual field loss after switching to DTFC and various factors, as well as multivariate odds ratios for visual field progression (n=14)