74
Views
10
CrossRef citations to date
0
Altmetric
Original Research

The association between neovascular age-related macular degeneration and regulatory T cells in peripheral blood

, &
Pages 1147-1154 | Published online: 25 Jun 2015

Figures & data

Figure 1 Flow cytometric identification of regulatory T cells (Tregs), nTregs (naïve Tregs) and RTE-Tregs (recent thymic emigrant Tregs) in the peripheral blood of a patient with AMD. Lymphocytes were identified and gated on a forward/side-scatter plot (A). CD4+ lymphocytes were then identified and gated on a CD4/F8 plot (B), and the percentage of CD4+ cells within the lymphocyte population was measured. The CD25highCD127low Treg population was identified and gated on a CD25/CD127 plot (C), and the percentage of Tregs within the CD4+ population was measured. Fluorochrome-matched negative isotype controls (IgG2b and IgG1) were used to set a gate containing 1% of the events, and the gates were transferred to a CD45RA histogram (D) and a CD31 histogram (E). The percentages of CD45RA+-naïve Tregs and CD31+ RTE-Tregs within the Treg population were measured. The letters A–D in figures 1D and 1E mark the gates containing 1% of the events.

Abbreviations: IgG, immunoglobulin G; FS, forward-scatter; SS, side-scatter; AMD, age-related macular degeneration.
Figure 1 Flow cytometric identification of regulatory T cells (Tregs), nTregs (naïve Tregs) and RTE-Tregs (recent thymic emigrant Tregs) in the peripheral blood of a patient with AMD. Lymphocytes were identified and gated on a forward/side-scatter plot (A). CD4+ lymphocytes were then identified and gated on a CD4/F8 plot (B), and the percentage of CD4+ cells within the lymphocyte population was measured. The CD25highCD127low Treg population was identified and gated on a CD25/CD127 plot (C), and the percentage of Tregs within the CD4+ population was measured. Fluorochrome-matched negative isotype controls (IgG2b and IgG1) were used to set a gate containing 1% of the events, and the gates were transferred to a CD45RA histogram (D) and a CD31 histogram (E). The percentages of CD45RA+-naïve Tregs and CD31+ RTE-Tregs within the Treg population were measured. The letters A–D in figures 1D and 1E mark the gates containing 1% of the events.

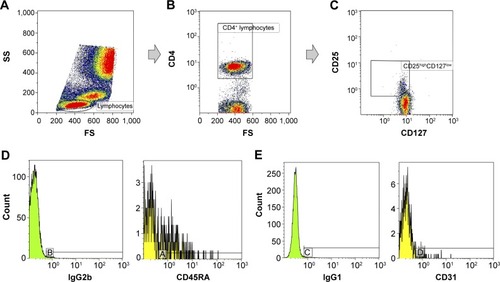
Table 1 Demographics and clinical characteristics of study participants with neovascular age-related macular degeneration and healthy controls

Figure 2 Percentages of CD4+ lymphocytes, CD25highCD127low Tregs, CD45RA+-naïve Tregs, and CD31+ RTE-Tregs in the peripheral blood of patients with neovascular age-related macular degeneration and healthy controls.

Notes: A and B; Bars – means, whiskers – SD; C, D, E and F: Dots = medians, whiskers = interquartile ranges.

Abbreviations: AMD, age-related macular degeneration; SD, standard deviation; Tregs, regulatory T cells; RTE-Tregs, recent thymic emigrant Tregs.
Figure 2 Percentages of CD4+ lymphocytes, CD25highCD127low Tregs, CD45RA+-naïve Tregs, and CD31+ RTE-Tregs in the peripheral blood of patients with neovascular age-related macular degeneration and healthy controls.Notes: A and B; Bars – means, whiskers – SD; C, D, E and F: Dots = medians, whiskers = interquartile ranges.

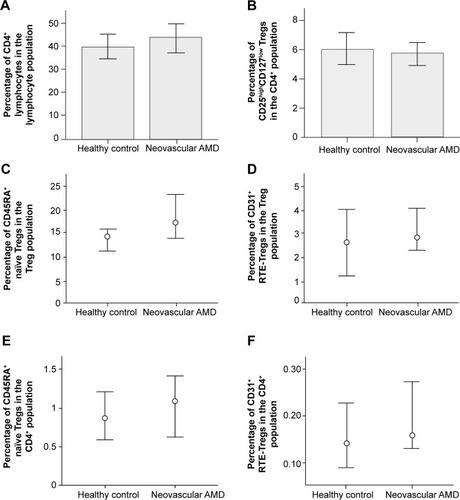
Table 2 Percentages of lymphocytes in the peripheral blood of patients with neovascular age-related macular degeneration and healthy controls