Figures & data
Table 1 Normative Values for Subjects Aged 8–12 YearsCitation5
Table 2 Demographics and Refractive Status of Participants
Table 3 Binocular Status of Participants
Table 4 Baseline Measurements
Table 5 Comparison of Outcome Measurements Before and After 6 Weeks of Treatment
Figure 1 Change of MAF and BAF after 6 weeks of treatment with ADD or VT. The boxplot represents the interquartile range and the median value. Whiskers indicate range of values, excluding outliers. Statistical comparison of groups was performed by means of Mann–Whitney U test.
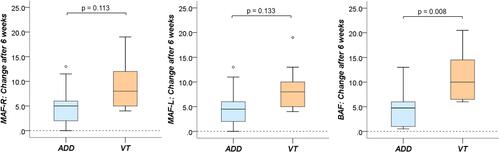
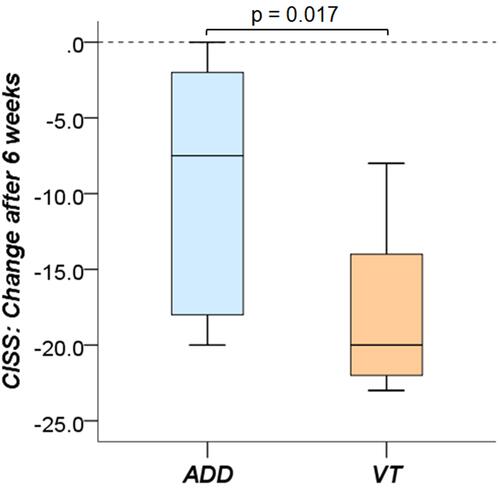
Figure 2 Change of CISS after 6 weeks of treatment with ADD or VT. The boxplot represents the interquartile range and the median value. Whiskers indicate range of values, excluding outliers. Statistical comparison of groups was performed by means of Mann–Whitney U test.