
Figures & data
Figure 1 Morphological characteristics of immune cells.
Abbreviations: CB, cord blood; DC, dendritic cells; CB-DC-CIK, cord blood-derived dendritic cells and cytokine-induced killer cells.
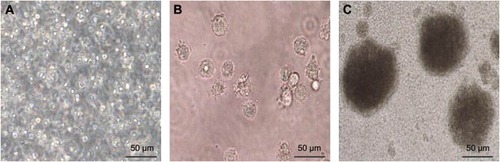
Figure 2 The proliferation rate of CD3+ (A) and CD3+CD56+ (B) subsets and the changes in CB-DC and CB-DC-CIK cell phenotypes over different culture times (C and D).
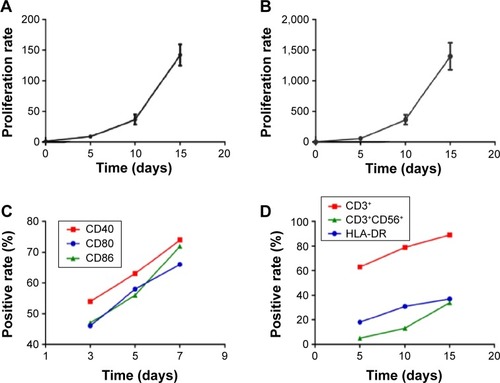
Figure 3 Cytotoxicity of different numbers of CB-DC-CIK against the gastric cancer cell lines SGC7901 (A) and BGC823 (B) was tested by CCK-8 assay. *P<0.05, **P<0.01.
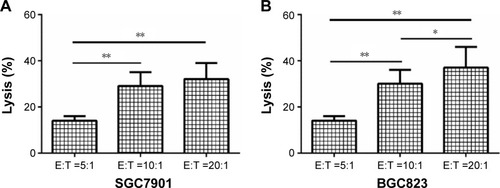
Table 1 Expression of cytokines, including IFN-γ, TNF-α, and IL-2, of CB-DC-CIK after in vitro culture for 8 and 15 days
Table 2 Clinical characteristics of the patients with advanced gastric cancer in the two groups
Table 3 Comparison of the ORR and DCR between the two groups
Figure 4 Kaplan–Meier estimates for OS and DFS for patients in the two groups (A and B), 1- and 2-year OS and the DFS rate in the two groups (C and D).
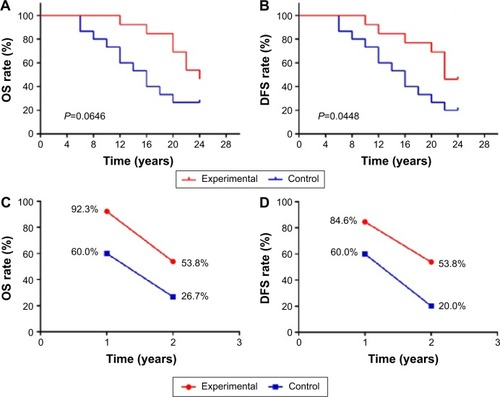
Table 4 Tumor markers including CEA, CA199, and CA724 in the two groups (mean ± sd, %)
Table 5 T lymphocyte subsets in the two groups (mean ± sd, %)
Table 6 Expression of cytokines including IFN-γ, TNF-α, and IL-2 in the two groups (mean ± sd, %)
Table 7 Comparison of the adverse effects between the two groups