Figures & data
Notes: **P<0.05. qRT-PCR analysis of the expression levels of fibronectin 1 in PTC tissues (unmetastasized, n=50; metastasized, n=40) (A) and PTC cell lines (TPC1 and K1) (B). The values were normalized to GAPDH mRNA expression. Data expressed as means ± standard deviation of three independent experiments. (C, D) Western blot analysis of fibronectin 1 in TPC1 and K1 cells. GAPDH was used as a loading control.
Abbreviations: PTC, papillary thyroid cancer; qRT-PCR, quantitative reverse-transcription polymerase chain reaction; mRNA, messenger RNA.
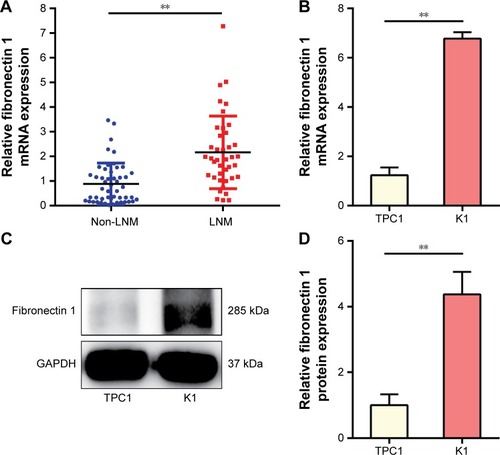
Notes: The ROC curve of fibronectin 1 predicted the presence of lymph node metastasis in papillary thyroid cancer in terms of sensitivity and specificity: AUC 0.814 (0.723–0.905), P<0.000.
Abbreviations: ROC, receiver-operating characteristic; AUC, area under the curve.
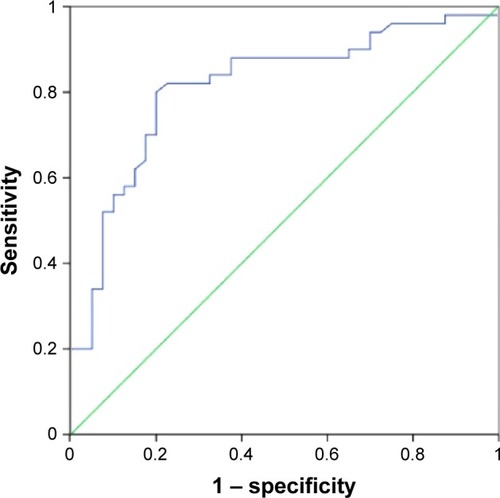
Notes: *P<0.05; **P<0.01. (A) qRT-PCR analysis of mRNA fibronectin 1-expression levels in K1 cells transfected with fibronectin 1-specific shRNA using Lipofectamine on days 3, 5, 7, and 10. (B) Western blot analysis of fibronectin 1 in K1 cells transfected with fibronectin 1-specific shRNA. (C) CCK-8 assays were performed to determine K1 cell proliferation after 0, 12, 24, 36, 48, and 72 hours following transfection with fibronectin 1-specific shRNA. (D) A colony-formation assay was performed to determine the proliferation of K1 cells transfected with fibronectin 1-specific shRNA. (E) Colony-formation assay results. (F) Flow-cytometry images of the cell cycle in K1. (G) Results quantified in the cell cycle shown as a percentage of the total cells. All experiments were independently performed in triplicate. Data presented as means ± standard deviation.
Abbreviations: qRT-PCR, quantitative reverse-transcription polymerase chain reaction; mRNA, messenger RNA; shRNA, short hairpin RNA; Scr-shRNA, scrambled shRNA.
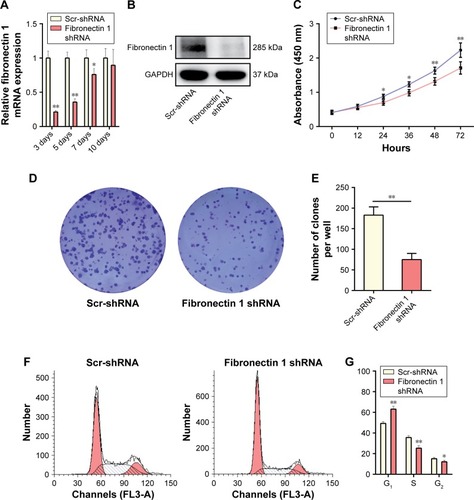
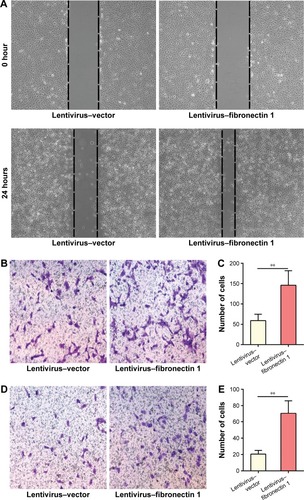
Notes: **P<0.01. (A) Wound-healing assays demonstrated the migration ability of K1 cells. Representative images at 0 and 24 hours are shown. (B) Transwell assays were performed to determine the migration ability of K1 cells with fibronectin 1 knockdown. Representative images of migrating cells at a lower chamber stained with crystal violet. (C) Transwell assays were performed to determine the invasion ability of K1 cells with fibronectin 1 knockdown. Representative images of invasive cells in the lower chamber stained with crystal violet. (D) Quantification of cell migration presented as migrated cell numbers. (E) Quantification of cell invasion presented as invasive cell numbers. All data expressed as means ± standard deviation of three independent experiments.
Abbreviations: shRNA, short hairpin RNA; Scr-shRNA, scrambled shRNA.
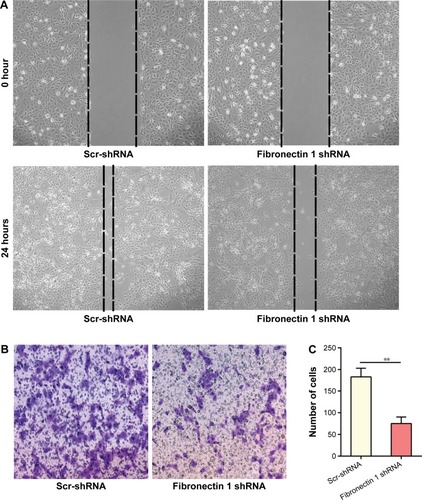
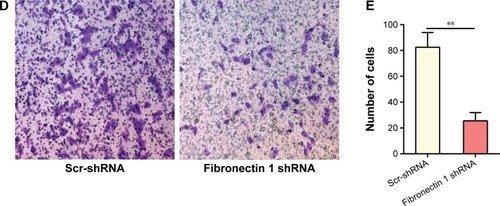
Notes: *P<0.05, **P<0.01. (A) qRT-PCR analysis of mRNA fibronectin 1-expression levels in TPC1 cells transfected with lentivirus–fibronectin 1 or lentivirus–vector on days 3, 5, 7, and 10. (B) Western blot analysis of fibronectin 1 in TPC1 cells transfected with fibronectin 1 plasmid. (C) CCK-8 assays were performed to determine TPC1 cell proliferation at 12, 24, 36, 48, and 72 hours following transfection with fibronectin 1 plasmid. (D) Colony formation assays were performed to determine the proliferation of TPC1 cells transfected with fibronectin 1 plasmid. (E) Colony-formation assay results. (F) Flow-cytometry images of the cell cycle in TPC1. (G) Results quantified in the cell cycle shown as a percentage of the total cells. All data expressed as means ± standard deviation of three independent experiments.
Abbreviations: qRT-PCR, quantitative reverse-transcription polymerase chain reaction; mRNA, messenger RNA.
Notes: **P<0.01. (A) Wound-healing assays were performed to determine the migration ability of TPC1 cells. Representative images at 0 and 24 hours are shown. (B) Transwell assays were performed to determine the migration ability of TPC1 cells with fibronectin 1 overexpression. Representative images of migrating cells in the lower chamber stained with crystal violet. (C) Transwell assays were performed to determine the invasion ability of TPC1 cells with fibronectin 1 overexpression. Representative images of invasive cells in the lower chamber stained with crystal violet. (D) Quantification of cell migration presented as migrated cell numbers. (E) Quantification of cell invasion presented as invasive cell numbers. All data expressed as means ± standard deviation of three independent experiments.