Figures & data
Figure 1 Flow diagram of the selection process.
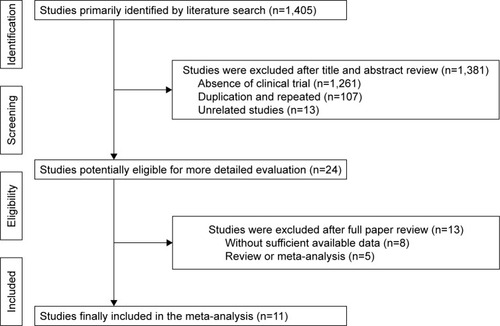
Table 1 Clinical information from the eligible trials used in the meta-analysis
Figure 2 Review of authors’ judgments about each risk of bias item for included studies.
Notes: (A) Risk of bias summary. (B) Risk of bias graph: review of authors’ judgments about each risk of bias item presented as percentages across all included studies.
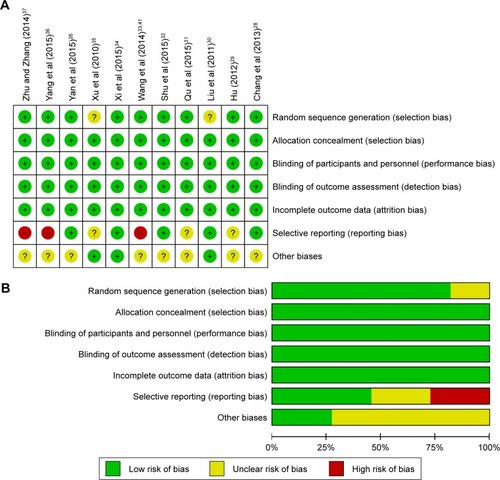
Figure 3 Forest plots of the comparisons of (A) OS and (B) ORR and DCR.
Note: The fixed-effects meta-analysis model (Mantel–Haenszel method) was used.
Abbreviations: CI, confidence interval; CIK/DC-CIK, immunotherapy with cytokine-induced killer cells or combination of dendritic cells and cytokine-induced killer cells; Cont, conventional therapy; DCR, disease control rate; M–H, Mantel–Haenszel method; ORR, overall response rate; OS, overall survival.
Abbreviations: CI, confidence interval; CIK/DC-CIK, immunotherapy with cytokine-induced killer cells or combination of dendritic cells and cytokine-induced killer cells; Cont, conventional therapy; DCR, disease control rate; M–H, Mantel–Haenszel method; ORR, overall response rate; OS, overall survival.
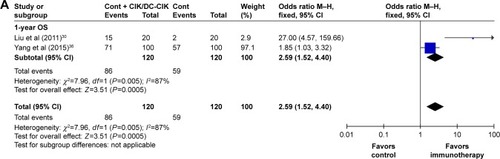
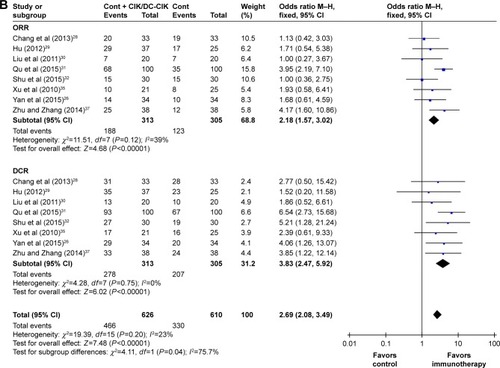
Figure 4 Forest plot for the comparison of QIR.
Note: The fixed-effects meta-analysis model (Mantel–Haenszel method) was used.
Abbreviations: CI, confidence interval; CIK/DC-CIK, immunotherapy with cytokine-induced killer cells or combination of dendritic cells and cytokine-induced killer cells; Cont, conventional therapy; M–H, Mantel–Haenszel method; QIR, quality-of-life improved rate.
Abbreviations: CI, confidence interval; CIK/DC-CIK, immunotherapy with cytokine-induced killer cells or combination of dendritic cells and cytokine-induced killer cells; Cont, conventional therapy; M–H, Mantel–Haenszel method; QIR, quality-of-life improved rate.
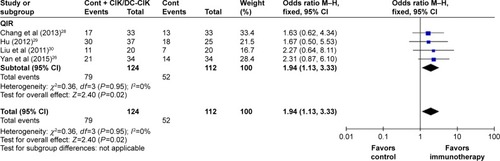
Figure 5 Forest plot of immunophenotype assessment before and after treatment with CIK/DC-CIK.
Note: The random-effects meta-analysis model (Mantel–Haenszel method) was used in this analysis.
Abbreviations: CD, cluster of differentiation; CI, confidence interval; CIK/DC-CIK, immunotherapy with cytokine-induced killer cells or combination of dendritic cells and cytokine-induced killer cells; SD, standard deviation.
Abbreviations: CD, cluster of differentiation; CI, confidence interval; CIK/DC-CIK, immunotherapy with cytokine-induced killer cells or combination of dendritic cells and cytokine-induced killer cells; SD, standard deviation.
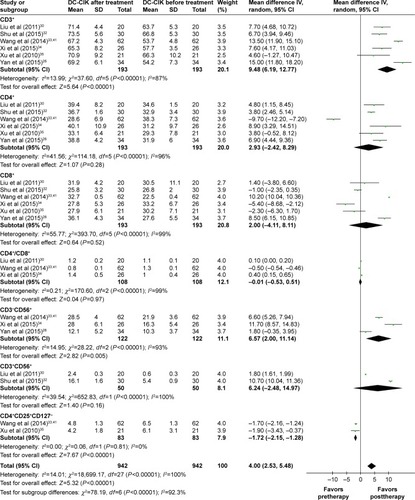
Figure 6 Forest plot of cytokines before and after treatment with CIK/DC-CIK.
Note: The fixed-effects meta-analysis model (Mantel–Haenszel method) was used in this analysis.
Abbreviations: CI, confidence interval; CIK/DC-CIK, immunotherapy with cytokine-induced killer cells or combination of dendritic cells and cytokine-induced killer cells; IFN, interferon; IL, interleukin; SD, standard deviation; TNF, tumor necrosis factor.
Abbreviations: CI, confidence interval; CIK/DC-CIK, immunotherapy with cytokine-induced killer cells or combination of dendritic cells and cytokine-induced killer cells; IFN, interferon; IL, interleukin; SD, standard deviation; TNF, tumor necrosis factor.
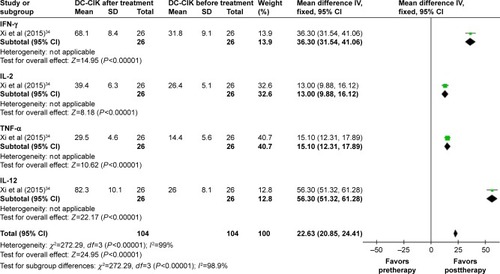
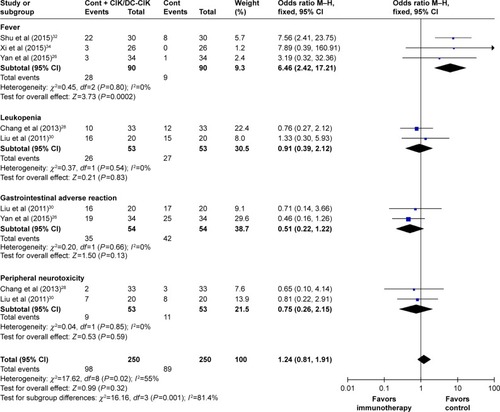
Figure 7 Forest plot of the comparison of adverse effects.
Note: The random-effects meta-analysis model (Mantel–Haenszel method) was used in this analysis.
Abbreviations: CI, confidence interval; CIK/DC-CIK, immunotherapy with cytokine-induced killer cells or combination of dendritic cells and cytokine-induced killer cells; Cont, conventional therapy; M–H, Mantel–Haenszel method.
Abbreviations: CI, confidence interval; CIK/DC-CIK, immunotherapy with cytokine-induced killer cells or combination of dendritic cells and cytokine-induced killer cells; Cont, conventional therapy; M–H, Mantel–Haenszel method.