Figures & data
Figure 1 Expression of β-catenin in GBM tissues.
Notes: (A) Representative immunohistochemical staining in GBM tissues and NB tissues. Quantitative analysis showed that the expression of β-catenin is higher in GBM tissues than in NB tissues. Data shown are means ± SEM of at least three independent experiments. *P<0.001, using one-way ANOVA. (B) The expression of β-catenin in GBM tissues and NB tissues was determined by RT-PCR analysis. The expression levels were compared to NB tissues. GAPDH was used as a loading control. The intensity of bands was quantified using imageJ software and normalized to GAPDH. Data shown are means ± SEM of at least three independent experiments. *P<0.001, using one-way ANOVA. (C) The expression of β-catenin in GBM tissues and NB tissues was determined by Western blot analysis. The expression levels were compared to NB tissues. β-actin was used as a loading control. The intensity of bands was quantified using imageJ software and normalized to β-actin. Data shown are means ± SEM of at least three independent experiments. *P<0.001, using one-way ANOVA.
Abbreviations: GBM, glioblastoma multiforme; NB, normal brain; SEM, standard error of the mean; MOD, mean optical density; RT-PCR, reverse transcription polymerase chain reaction.
Abbreviations: GBM, glioblastoma multiforme; NB, normal brain; SEM, standard error of the mean; MOD, mean optical density; RT-PCR, reverse transcription polymerase chain reaction.
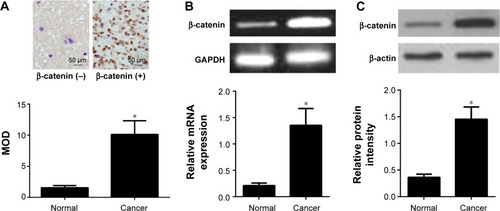
Figure 2 β-catenin regulates U87 cell proliferation.
Notes: (A) The expression of β-catenin in the normal human astrocytes and GBM cell lines (T98G, A172, U87, and U251) was determined by RT-PCR analysis. The expression levels were compared to NB tissues. GAPDH was used as a loading control. The intensity of bands was quantified using imageJ software and normalized to GAPDH. Data shown are means ± SEM of at least three independent experiments. *P<0.001, using one-way ANOVA. (B) The expression of β-catenin in the normal human astrocytes and GBM cell lines (T98G, A172, U87, and U251) was determined by Western blot analysis. The expression levels were compared to NB tissues. β-actin was used as a loading control. The intensity of bands was quantified using imageJ software and normalized to β-actin. Data shown are means ± SEM of at least three independent experiments. *P<0.001, using one-way ANOVA. (C) Line graphs showing the effects of β-catenin inhibition on the proliferation of EGF-induced U87 cells as compared with scrambled siRNA, determined using a CCK-8 assay at days 1, 2, and 3 post-siRNA transfection. Data shown correspond to one representative experiment out of the three performed. *P<0.001 vs EGF alone.
Abbreviations: GBM, glioblastoma multiforme; NB, normal brain; SEM, standard error of the mean; CCK-8, Cell counting kit-8; RT-PCR, reverse transcription polymerase chain reaction.
Abbreviations: GBM, glioblastoma multiforme; NB, normal brain; SEM, standard error of the mean; CCK-8, Cell counting kit-8; RT-PCR, reverse transcription polymerase chain reaction.
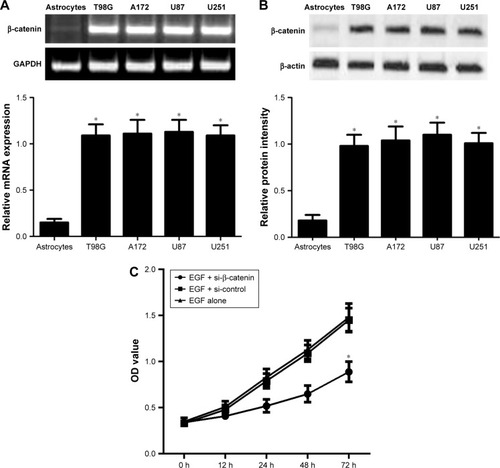
Figure 3 Inhibition of β-catenin expression suppresses the migration and invasion in U87 cells.
Notes: (A) Cell migration assay after inhibition with specific si-β-catenin in U87 cells. The gene knockdown of β-catenin siRNA significantly decreased cell migration as compared with universal scrambled siRNA. Representative images of decreased migration in U87 cells by si-β-catenin knockdown were shown in a wound-healing assay. *P<0.001 vs EGF alone, using one-way ANOVA. (B) Cell invasion assay after β-catenin inhibition with specific siRNA in the U87 cells. si-β-catenin significantly decreased cell invasion. Images displaying the bottom side of the filter inserts with cells which invaded through the filter pores. Column graphs represent cell count analysis using absorbance. Data shown correspond to one representative experiment out of the three performed. *P<0.001 vs EGF alone, using one-way ANOVA.
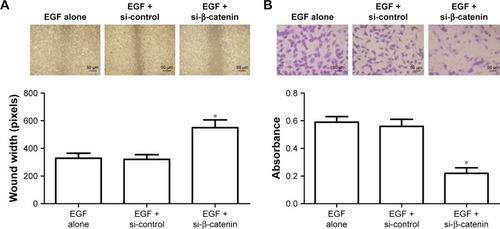
Figure 4 Inhibition of β-catenin expression suppresses EMT in U87 cells.
Notes: (A) Twenty-four hours after treatment with EGF, the cell lysates were prepared. Equivalent amounts of extracted protein were loaded on the gel and analyzed by immunoblotting for the phosphorylation of Akt and β-catenin. β-actin was used as the internal control. The expression levels of Akt and β-catenin were quantitated by densitometry. (B) No associations between the level of β-catenin phosphorylation and its activity were found (r2=0.169, P=0.184); in addition, si-catenin effectively knocked down the expression of β-catenin. (C) U87 cells were infected with EGF alone, EGF + si-β-catenin or EGF + si-control. Total RNA was prepared for the expression of EMT biomarkers by RT-PCR. The cell lysates were analyzed for the expression of EMT biomarkers by Western blot (D). The expression level was normalized to the levels of endogenous GAPDH mRNA and β-actin protein. *P<0.001 vs EGF alone.
Abbreviations: EMT, epithelial-mesenchymal transition; RT-PCR, reverse transcription polymerase chain reaction.
Abbreviations: EMT, epithelial-mesenchymal transition; RT-PCR, reverse transcription polymerase chain reaction.
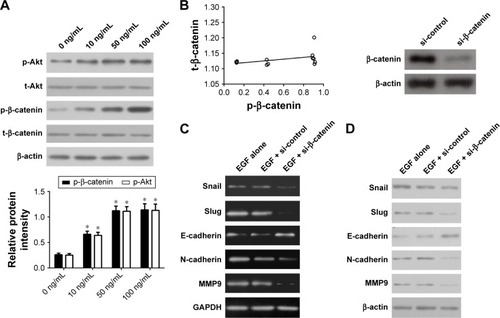
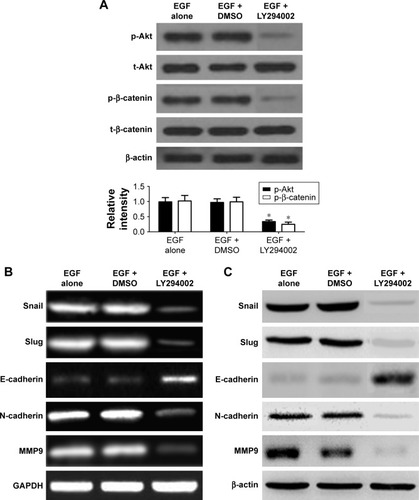
Figure 5 β-catenin activates EMT via the PI3K/Akt signaling pathways.
Notes: Inhibition of the PI3K/AKT signaling pathways by chemical inhibitors LY294002 (40 mM) was conducted. EGF-induced U87 cells were pretreated for 1 h with DMSO alone or 40 mM of LY294002, and then cultured in the presence of DMEM for 12 h. Cell lysates were prepared and the expressions of relevant proteins were analyzed by Western blotting and RT-PCR. (A) LY294002 downregulated the Akt phosphorylation (p-Akt) but not their total protein levels, resulting in the down-regulation of β-catenin phosphorylation expression. In addition, LY294002 downregulated the expression of Snail, Slug, N-cadherin and MMP9 mRNAs (B) and proteins (C), and upregulated the expression of E-cadherin mRNAs (B) and proteins (C). Each bar represents the mean ± SEM of three independent experiments; *P<0.001, compared with EGF alone, one-way ANOVA with the LSD post hoc test.
Abbreviations: DMSO, dimethyl sulfoxide; EMT, epithelial-mesenchymal transition; SEM, standard error of the mean; LSD, least significant difference; RT-PCR, reverse transcription polymerase chain reaction.
Abbreviations: DMSO, dimethyl sulfoxide; EMT, epithelial-mesenchymal transition; SEM, standard error of the mean; LSD, least significant difference; RT-PCR, reverse transcription polymerase chain reaction.