Figures & data
Table 1 High SNHG16 Expression and Low SNHG16 Expression Correlated with Clinicopathological Parameters of NB
Figure 1 High SNHG16 expression was associated with clinical stage and poor prognosis. (A) QRT-PCR was performed to measure SNHG16 expression level in NB tissues and corresponding adjacent normal tissues. (B) Kaplan-Meier was applied to analyze the survival according to the median level of SNHG16 expression. (C) qRT-PCR was used to detect the expression of SNHG16 in NB cell lines and HUVEC cells. *P<0.05.
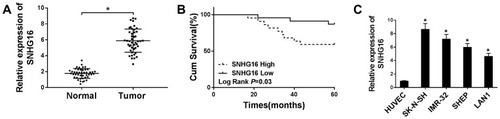
Figure 2 Silencing of SNHG16 suppressed proliferation, migration and invasion in NB cells. (A) The transfection efficiency of si-SNHG16#1, si-SNHG16#2 and si-SNHG16#3 in SK-N-SH and IMR-32 cells was determined by qRT-PCR. (B and C) The proliferation of SK-N-SH and IMR-32 cells transfected with si-SNHG16#2 was assessed with MTT assay. (D and E) The migration and invasion of SK-N-SH and IMR-32 cells transfected with si-SNHG16#2 was evaluated by transwell assay. *P<0.05.
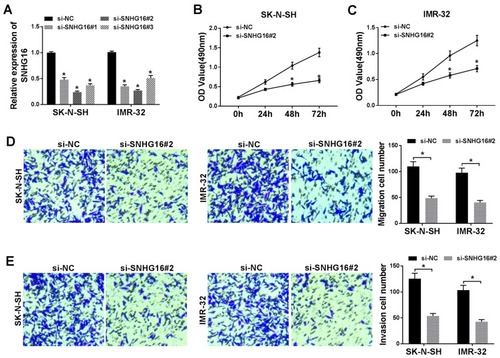
Figure 3 Knockdown of SNGH16 impeded the autophagy of NB cells. (A and B) The mRNA and protein expression of ATG5, p62 and LC3 in SK-N-SH cells transfected with si-SNHG16#2 were detected using qRT-PCR or Western blot analysis. (C and D) The mRNA and protein levels of ATG5, p62 and LC3 in IMR-32 cells transfected with si-SNHG16#2 were surveyed with qRT-PCR or Western blot analysis. *P<0.05.
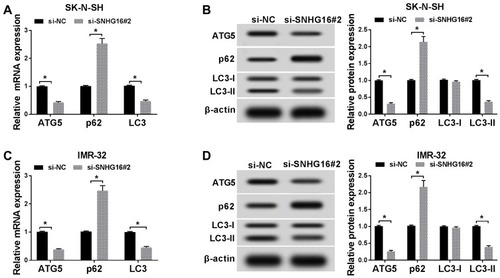
Figure 4 SNHG16 acted as a sponge of miR-542-3p in NB cells. (A)The binding sites between SNHG16 and miR-542-3p were predicted by starBase database. The red sequence indicated that the mutation in TUG1 was at the predicted miR-542-3p binding sites. (B and C) The luciferase activity in SK-N-SH and IMR-32 cells co-transfected miR-542-3p mimics or miR-NC and SNHG16 wt or SNHG16 mut was determined with dual-luciferase reporter assay. (D) The expression of SNHG16 mRNA in SK-N-SH and IMR-32 cells transfected with si-SNHG16#2 or si-NC was detected using qRT-PCR. (E) QRT-PCR was used to assess the expression of miR-542-3p in NB tissues and corresponding adjacent normal tissues. (F) Pearson’s correlation analysis was performed for the assessment of the relationship between SNHG16 and miR-542-3p in NB tissues. *P<0.05.
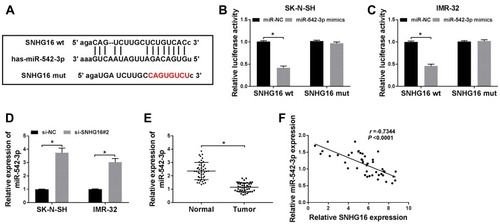
Figure 5 Downregulation of miR-542-3p reversed the effects of SNHG16 knockdown on NB cells. SK-N-SH and IMR-32 cells were transfected with miR-NC, miR-542-3p mimics, si-SNHG16#2+anti-NC or si-SNHG16#2+anti-miR-542-3p, respectively. (A and B) QRT-PCR was applied for the determination of the expression miR-542-3p in SK-N-SH and IMR-32 cells. (C and D) MTT assay was conducted to evaluate the proliferation ability of SK-N-SH and IMR-32 cells. (E and F) Transwell assay was used to determine the migration and invasion of SK-N-SH and IMR-32 cells. (G and H) Western blot analysis was utilized to measure the protein expression of LC3-I, LC3-II and p62 in SK-N-SH and IMR-32 cells. *P<0.05.
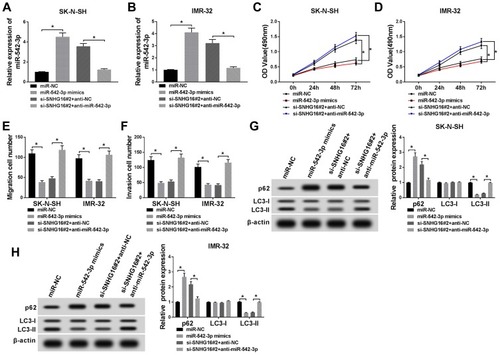
Figure 6 SNHG16 regulated ATG5 expression via binging to miR-542-3p. (A) The binding sites between ATG5 and miR-542-3p were predicted by starBase database. The red sequence indicated that the mutation in ATG5 was at the predicted miR-542-3p binding sites. (B and C) The luciferase activity was assessed by dual-luciferase reporter assay in SK-N-SH and IMR-32 cells co-transfected miR-542-3p mimics or miR-NC and ATG5 wt 3ʹUTR or ATG5 mut 3ʹUTR. (D) Western blot analysis was applied to detect ATG5 protein level in SK-N-SH and IMR-32 cells transfected with miR-NC or miR-542-3p mimics. (E) Western blot analysis of ATG5 protein expression in SK-N-SH and IMR-32 cells transfected with si-NC, si-SNHG16#2, si-SNHG16#2+anti-NC or si-SNHG16#2+anti-miR-542-3p, respectively. (F) QRT-PCR was utilized for the measurement of the expression level of ATG5 mRNA in NB tissues and corresponding adjacent normal tissues. (G and H) Pearson’s correlation analysis was used to determine the relationship between miR-542-3p and ATG5 and SNHG16 and ATG5 in NB tissues. *P<0.05.
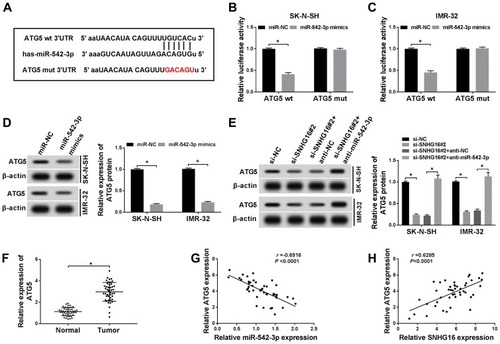
Figure 7 Effects of ATG5 on SNHG16 or miR-542-3p knockdown-mediated proliferation, migration, invasion and autophagy of NB cells. SK-N-SH and IMR-32 cells were transfected with si-SNHG16#2+pcDNA, si-SNHG16#2+pcDNA-ATG5, anti-miR-542-3p+anti-NC or anti-miR-542-3p+anti-ATG5, respectively. (A and B) ATG5 protein expression level in SK-N-SH and IMR-32 cells was assessed by Western blot analysis. (C and D) MTT assay was conducted for the determination of the proliferation of SK-N-SH and IMR-32 cells. (E and F) Transwell assay was performed for the assessment of the migration and invasion of SK-N-SH and IMR-32 cells. (G and H) Western blot analysis was used for the detection of the protein expression levels of LC3-I, LC3-II and p62 in SK-N-SH and IMR-32 cells. *P<0.05.
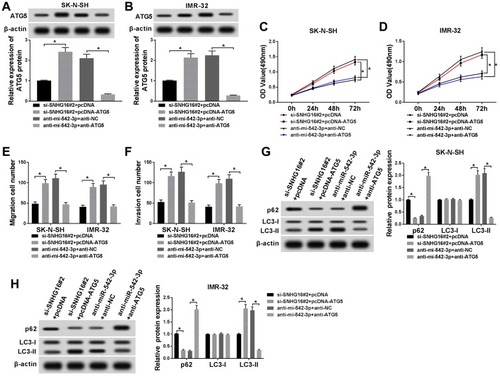
Figure 8 Knockdown of SNHG16 suppressed tumor growth of NB in vivo. (A) Tumor volume curves for the sh-NC and sh-SNHG16 groups. (B) Tumor weight and picture of the sh-NC and sh-SNHG16 groups. (C and D) The expression of SNHG16 and miR-542-3p was measured with qRT-PCR in the sh-SNHG16 group and control group. (E) QRT-PCR was utilized for the measurement of the mRNA expression levels of ATG5, LC3 and p62 in tumor tissues of sh-SNHG16 group and control group. (F) Western blot analysis was utilized to detect the protein expression levels of ATG5, LC3-I, LC3-II and p62 in tumor tissues of sh- SNHG16 group and control group. *P<0.05.
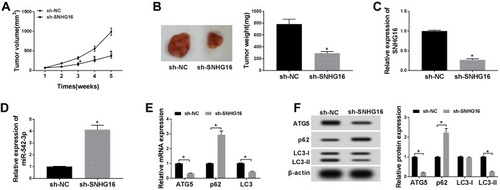
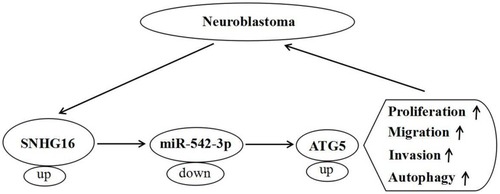
Figure 9 A schematic diagram of SNHG16 in the progression of ESCC.