Figures & data
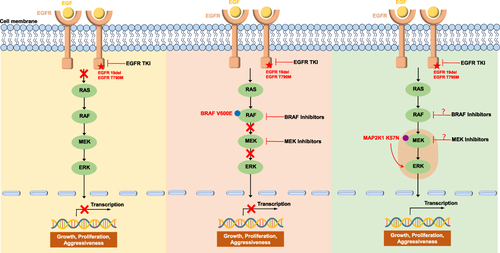
Figure 1 Schematic of treatment history of the patient. (A) The timeline of treatment (red arrow indicates the primary tumor and red circles indicate metastatic tumors). (B–E) Chest CT images and brain MRI throughout the disease course.
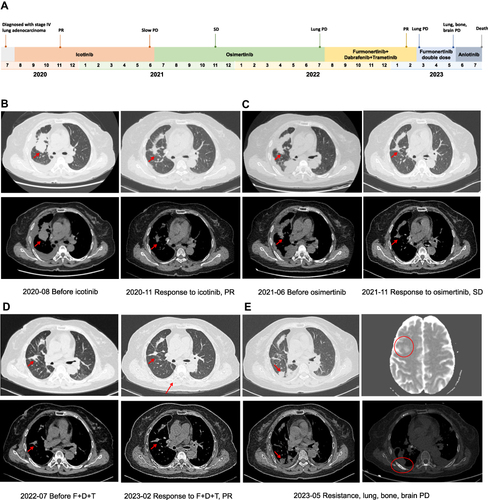
Figure 2 Serial tumor tissue or ctDNA NGS analysis. (A) Presumed clonal evolution of our case. The horizontal axis suggests the clinical history, and the vertical axis represents tumor volume. NGS analysis assessed at the time of diagnosis revealed a high allelic fraction of EGFR, which decreased at the time of resistance. An BRAF V600E mutation had emerged when the patient resistant to osimertinib. After 8 months of treatment with furmonertinib, dabrafenib, and trametinib, the BRAF V600E was undetectable, but a new MAP2K1 K57N mutation had emerged. (B) Detected alterations and its’ mutation frequency trend. Solid blue circles represent the mutation frequencies which tested from tissue samples. Filled red triangles represent the mutation frequencies which tested from ctDNA.
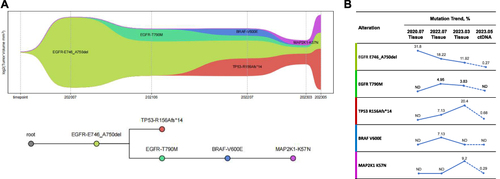
Figure 3 Schematic representation of Ras/RAF/MEK/ERK signaling pathway activation or inhibition at different stages of treatment in our case.