Figures & data
Figure 1 Schematic diagram of study design.
Abbreviations: AgNPs, silver nanoparticles; TUNEL, terminal deoxynucleotidyl transferase mediated deoxyuridine triphosphatase nick end labeling.
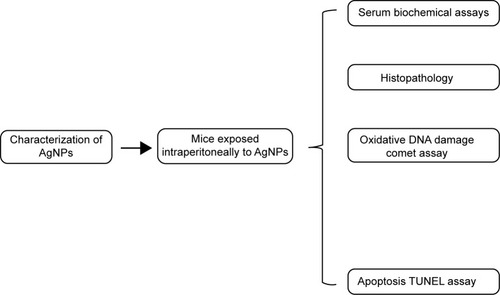
Figure 2 Characterization of the AgNPs.
Notes: TEM image of the particles (A). The size distribution histogram generated by using a TEM image (B).
Abbreviations: AgNPs, silver nanoparticles; TEM, transmission electron microscopy.
Abbreviations: AgNPs, silver nanoparticles; TEM, transmission electron microscopy.
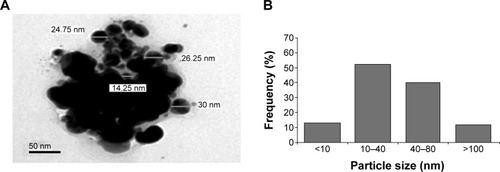
Figure 3 Levels of enzymes that indicate liver function after exposure to AgNPs.
Notes: Levels of ALP (A), ALT (B), and AST (C) in liver tissue samples of Swiss albino mice after exposure to AgNPs for 24 hours and for 72 hours. Each value represents the mean ± SEM of three experiments. *P<0.05 indicates a statistically significant higher concentration of substance in mice exposed to AgNPs than in control mice.
Abbreviations: ALP, alkaline phosphatase; ALT, alanine aminotransferase; AST, aspartate aminotransferase; IU, international units; bw, body weight; AgNPs, silver nanoparticles; SEM, standard error of mean.
Abbreviations: ALP, alkaline phosphatase; ALT, alanine aminotransferase; AST, aspartate aminotransferase; IU, international units; bw, body weight; AgNPs, silver nanoparticles; SEM, standard error of mean.
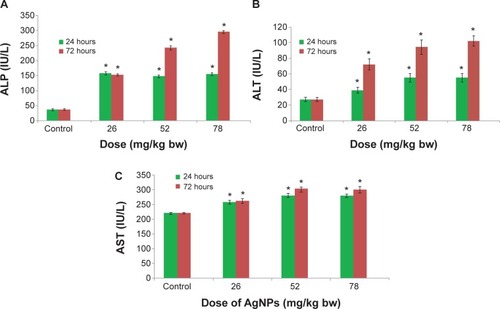
Figure 4 Liver cell apoptosis after 72 hours of exposure to AgNPs.
Notes: Apoptosis of cells in liver tissue of Swiss albino mice after exposure to AgNPs over 72 hours. Control (A); 26 mg AgNPs per kg bw (B); 52 mg AgNPs per kg bw (C); and 78 mg AgNPs per kg bw (D). Scale bar (▬) 20 μm.
Abbreviations: AgNPs, silver nanoparticles; bw, body weight.
Abbreviations: AgNPs, silver nanoparticles; bw, body weight.
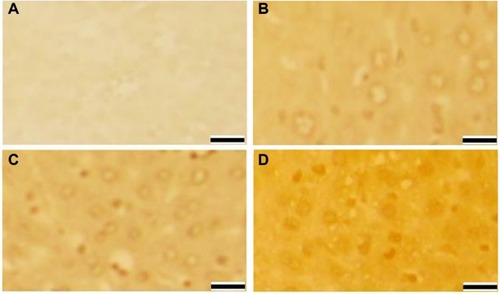
Figure 5 DNA damage in lymphocytes of Swiss albino mice after exposure to AgNPs.
Notes: Control (A); 78 mg AgNPs per kg bw for 24 hours (B); and 78 mg AgNPs per kg bw for 72 hours (C). Percent tail DNA. Data are presented as mean ± SEM of three experiments (D). *P<0.05 indicates statistically significant difference with respect to the control. Scale bar (▬) 20 μm.
Abbreviations: AgNPs, silver nanoparticles; bw, body weight; SEM, standard error of mean.
Abbreviations: AgNPs, silver nanoparticles; bw, body weight; SEM, standard error of mean.
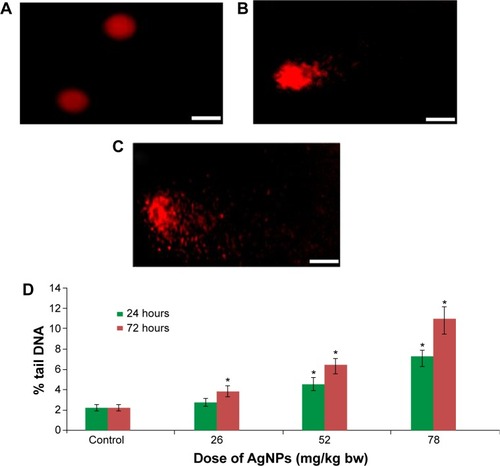
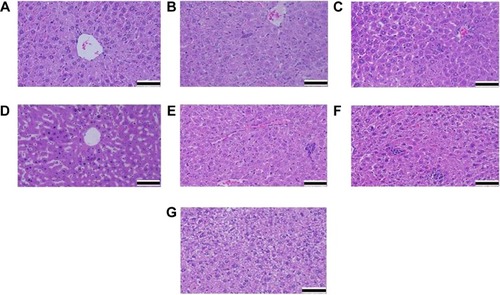
Figure 6 Microphotographs of hematoxylin and eosin stained liver tissue.
Notes: Mice injected with Milli-Q water demonstrated normal histological architecture after 72 hours of treatment (A). Mice injected with AgNPs (26 mg/kg bw) demonstrated lymphocyte infiltration in the hepatic portal space after 24 hours of treatment (B). Mice injected with AgNPs (52 mg/kg bw) demonstrated marked necrosis and scattered hemorrhages after 24 hours of treatment (C). Mice injected with AgNPs (78 mg/kg bw) demonstrated vacuolization of hepatocytes after 24 hours of treatment (D). Mice injected with AgNPs (26 mg/kg bw) demonstrated edema around the blood vessel after 72 hours of treatment (E). Mice injected with AgNPs (52 mg/kg bw) demonstrated binucleation of hepatocytes and lymphocytic infiltration after 72 hours of treatment (F). Mice injected with AgNPs (78 mg/kg bw) demonstrated swelling and hydropic degeneration of hepatocytes after 72 hours of treatment (G). All scale bars (▬) 50 μm. All image magnifications are 100×.
Abbreviations: AgNPs, silver nanoparticles; bw, body weight.
Abbreviations: AgNPs, silver nanoparticles; bw, body weight.