Figures & data
Figure 1 Time-dependent cell proliferation evaluation for EGCG treatment at different EGCG doses (0, 10, 20, 50, 100, and 200 μM), in SSC-4 cells, using the xCELLigence system.
Abbreviations: EGCG, Epigallocatechin-3-gallate; IC50, half maximal inhibitory concentration; RTCA, real-time cell analysis.
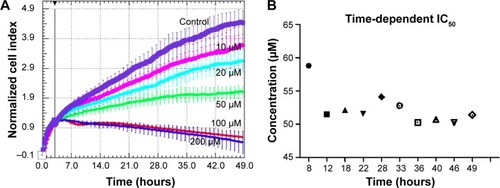
Figure 2 Flow cytometry evaluation using annexin V FITC/PI, showing the effects of 20 μM EGCG treatment for 24 hours and 48 hours on SSC-4 cells.
Abbreviations: EGCG, epigallocatechin-3-gallate; FITC, fluorescein isothiocyanate; PI, propidium iodide.
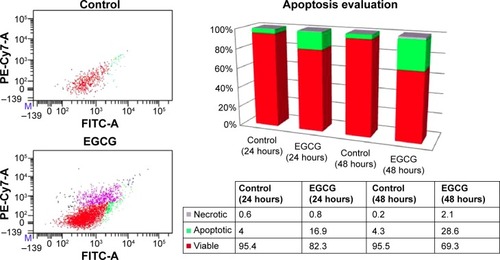
Figure 3 EGCG-induced autophagy in SSC-4 cells, using fluorescence microscopy evaluation after MDC staining.
Abbreviations: EGCG, epigallocatechin-3-gallate; MDC, monodansylcadaverine.
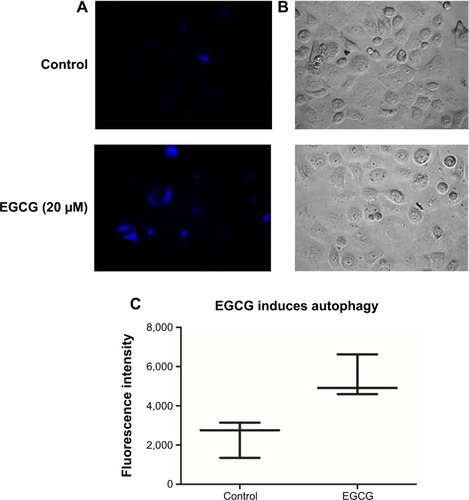
Figure 4 Relative gene expression level showing the effect of treatment with a single dose of EGCG (20 μM), at 24 hours posttreatment.
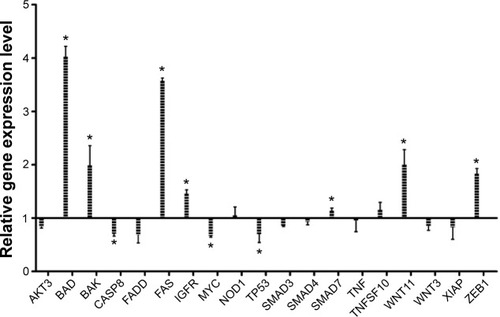
Figure 5 Gene network, created using IPA® software, reflecting EGCG treatment.
Abbreviations: EGCG, epigallocatechin-3-gallate; IPA, Ingenuity® Pathway Analysis.
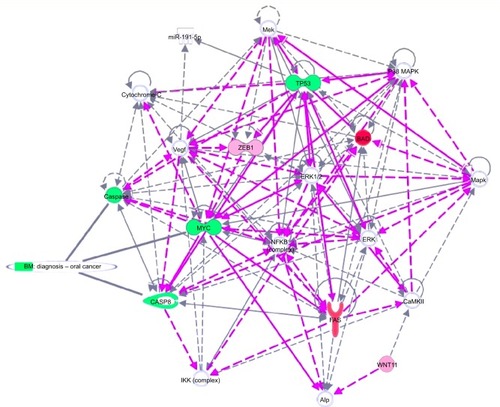
Figure 6 Putative model of multiple antitumoral mechanisms activated by EGCG, in SSC-4 human oral cancer cells.
Abbreviation: EGCG, epigallocatechin-3-gallate.
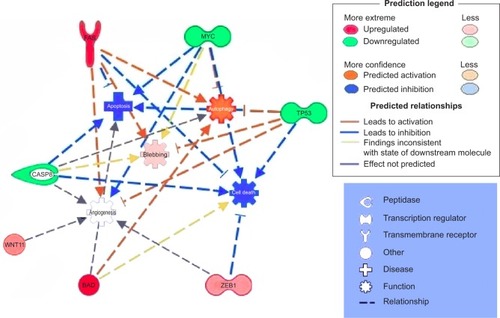
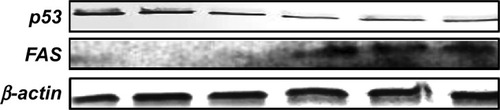
Figure 7 p53, FAS, and β-actin immunoblotting on SSC-4 cells, showing the effects of treatment with a single dose of EGCG (20 μM), at 48 hours posttreatment.