Figures & data
Figure 1 Flow diagram of study selection process.
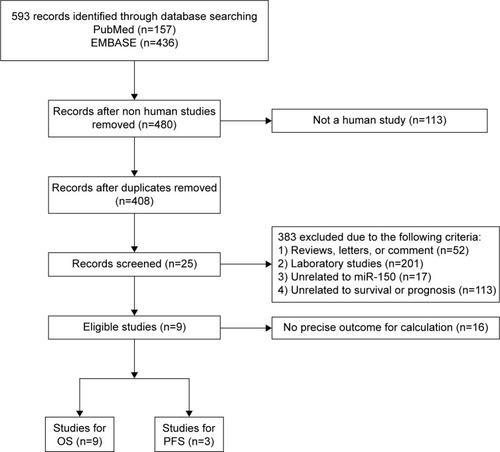
Table 1 Main features of the enrolled studies
Table 2 Difference in the overall survival and progression-free survival between high- and low-expression cases of microRNA-150 in the enrolled studies
Figure 2 Forest plots of merged analyses of OS in association with microRNA-150 expression.
Abbreviations: CIs, confidence intervals; df, degrees of freedom; HRs, hazard ratios; OS, overall survival; SE, standard error; IV, inverse variance.
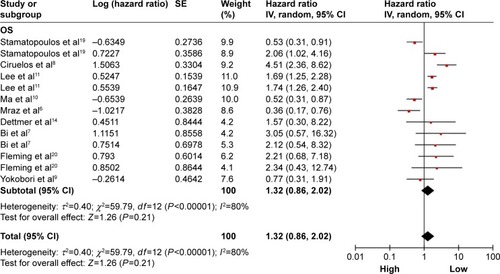
Figure 3 Forest plots of merged analyses of OS in different subgroups in association with microRNA-150 expression.
Abbreviations: CIs, confidence intervals; df, degrees of freedom; HRs, hazard ratios; OS, overall survival; SE, standard error; IV, inverse variance.
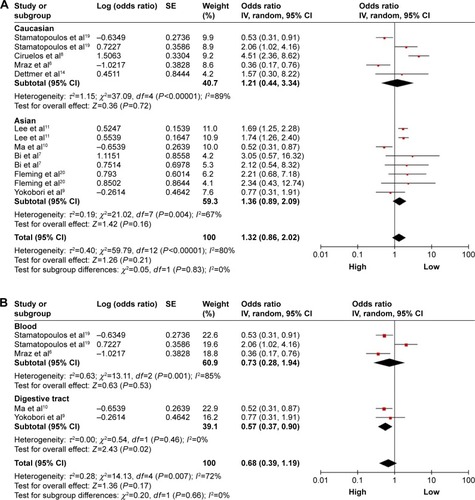
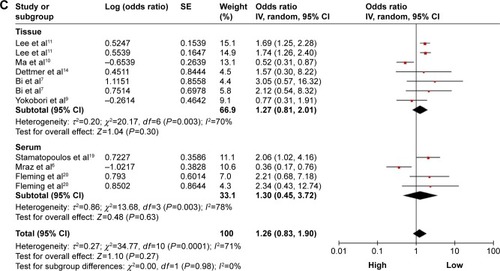
Table 3 Pooled HRs, 95% CIs, and P-values for OS stratified by ethnicity, disease system, and detected sample for overall and subgroup analyses
Figure 4 Forest plots of merged analyses of PFS in association with microRNA-150 expression.
Abbreviations: CIs, confidence intervals; df, degrees of freedom; HRs, hazard ratios; PFS, progression-free survival; SE, standard error; IV, inverse variance.
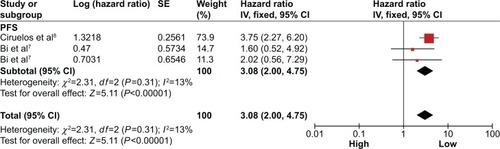
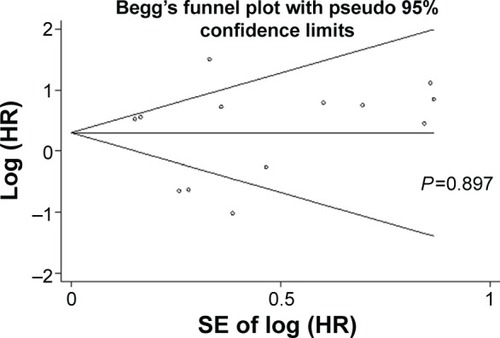
Figure 5 Begg’s funnel plots of the publication bias for overall merged analysis of OS.
Abbreviations: HR, hazard ratio; OS, overall survival; SE, standard error.