Figures & data
Table 1 Current Clinical Trials Studying Oncolytic Adenovirus In High-Grade Glioma
Figure 1 Genomic structure of oncolytic adenoviruses currently used in pre-clinical and clinical studies on high-grade glioma. ITR, inverted terminal repeat. E1AΔ24: a deletion of 24 base pairs within the E1A region. DM: insulator DM-1. E2Fp: E2F-responsive promoter. K: a Kozak sequence. E2F-pal: E2F-responsive palindromes (8 E2F-binding sites). PH20: human sperm PH20 hyaluronidase cDNA. RGD: an RGD integrin-binding motif in the HI loop of the fiber. RGDK: RGDK in the putative heparin sulfate-glycosaminoglycans binding domain KKTK in the fiber shaft. pCMV: the cytomegalovirus promoter. mOX40L: mouse OX40L cDNA. BGH pA: bovine growth hormone poly-adenylation signal. The mOX40L expression cassette replaces the E3 region in Delta-24-RGDOX.
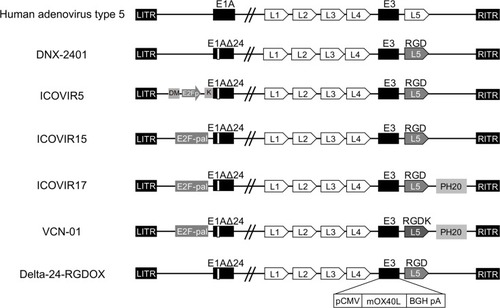
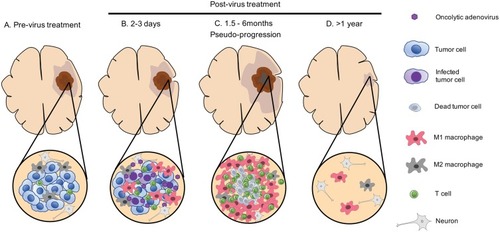
Figure 2 Dynamic changes that occur over time within the tumor microenvironment after oncolytic adenovirus therapy of glioblastoma. Upper, macroscopic and radiographic changes. Lower, microscopic-level changes. (A) Before treatment, the GBM tumor microenvironment is immune-suppressive as characterized by M2-polarized macrophages and few effector T cells. (B) A few days after virus administration, oncolytic adenovirus is actively replicating within the tumor, starting to induce the recruitment of effector T cells and macrophages with a shift from an M2 to M1 phenotype. (C) A few months later, the tumor exhibits an increase in size on magnetic resonance imaging (MRI). At this stage, virus has been cleared, but an active inflammatory reaction persists with the infiltration of immune cells such as T cells and M1-polarized macrophages. Tumor cells are essentially absent (necrosis), despite the worsening of imaging (pseudo-progression). (D) During the follow-up, inflammation gradually subsides and MRI shows progressive regression of the lesion and associated edema, which could take over a year.