176
Views
0
CrossRef citations to date
0
Altmetric
Original Research

Impact of Induced Syncytia Formation on the Oncolytic Potential of Myxoma Virus

, &
Pages 57-69 | Published online: 09 Dec 2019

Figures & data

Table 1 Origin of F Proteins Used in the Current Study

Figure 1 Construction of fusogenic MYXV constructs. (A) Genomic structure of generated fusogenic viruses. (B) Expression of c-Myc-tagged F proteins during infection measured by immunoblot. Expression of GFP is included to track overall infection and expression of actin is included as a loading control. Data are representative of three independent experiments. (C) Expression of c-Myc-tagged F proteins during infection measured by immune fluorescence for c-Myc (red). Infected cells can be identified by GFP expression. Note that images have been contrast-enhanced to increase visualization of c-Myc. (D) Images of GFP+ foci resulting from infection of BSC40 cells with the indicated viral construct.
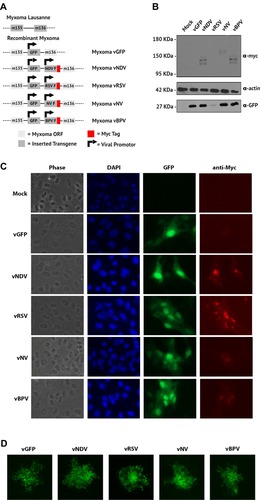
Figure 1 Construction of fusogenic MYXV constructs. (A) Genomic structure of generated fusogenic viruses. (B) Expression of c-Myc-tagged F proteins during infection measured by immunoblot. Expression of GFP is included to track overall infection and expression of actin is included as a loading control. Data are representative of three independent experiments. (C) Expression of c-Myc-tagged F proteins during infection measured by immune fluorescence for c-Myc (red). Infected cells can be identified by GFP expression. Note that images have been contrast-enhanced to increase visualization of c-Myc. (D) Images of GFP+ foci resulting from infection of BSC40 cells with the indicated viral construct.

Figure 2 Fusogenic MYXV’s form multinucleated syncytia. BSC40 cells were infected with the indicated viral construct. After 48 hrs, cells were stained with phalloidin and Hoechst stain to identify the cytoskeleton and nucleus, respectively, and fluorescent images of infected regions were then taken.
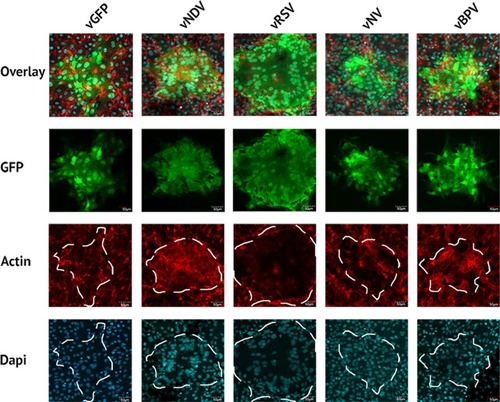
Figure 2 Fusogenic MYXV’s form multinucleated syncytia. BSC40 cells were infected with the indicated viral construct. After 48 hrs, cells were stained with phalloidin and Hoechst stain to identify the cytoskeleton and nucleus, respectively, and fluorescent images of infected regions were then taken.

Figure 3 In vitro characterization of fusogenic constructs. (A) BSC40 and A9F1 cells were infected with the indicated virus at an MOI of 10. Cells were harvested 3, 6, 12, 24, 48, and 72 hrs post-infection and the amount of infectious virus present analyzed using standard foci forming assays. (B) BSC40 and A9F1 cells were plated in triplicate into 96-well plates and infected as described. Cellular viability was measured via MTT assay at 24 hrs intervals post-infection. (C) BSC40 and A9F1 cells were infected at an MOI of 0.001 and images of GFP+ foci taken at 24, 48, and 72 hrs post-infection. (D) Size of individual foci were quantitated using ImageJ software. Data presented are representative of three individual experiments. Significance was determined using Student’s t-test (*p < 0.05, **p<0.005).
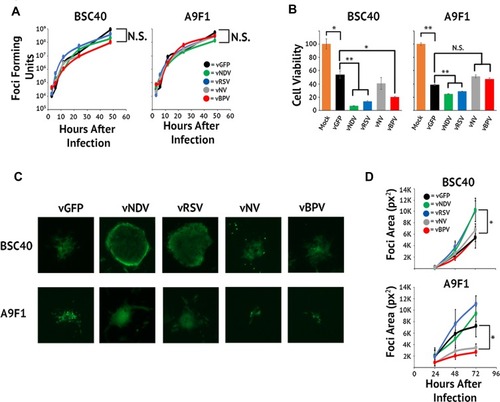
Figure 3 In vitro characterization of fusogenic constructs. (A) BSC40 and A9F1 cells were infected with the indicated virus at an MOI of 10. Cells were harvested 3, 6, 12, 24, 48, and 72 hrs post-infection and the amount of infectious virus present analyzed using standard foci forming assays. (B) BSC40 and A9F1 cells were plated in triplicate into 96-well plates and infected as described. Cellular viability was measured via MTT assay at 24 hrs intervals post-infection. (C) BSC40 and A9F1 cells were infected at an MOI of 0.001 and images of GFP+ foci taken at 24, 48, and 72 hrs post-infection. (D) Size of individual foci were quantitated using ImageJ software. Data presented are representative of three individual experiments. Significance was determined using Student’s t-test (*p < 0.05, **p<0.005).

Figure 4 Fusogenic MYXV’s retain their IFN mediated cancer tropism. (A) MEF cells were infected at an MOI of 0.001. Cells were treated with IFN-β either 1-hr pre-infection or 1-hr post-infection. Images of GFP+ foci were then taken at 24, 48, and 72 hrs post-infection. (B and C) Size of individual foci were quantitated using ImageJ software. Data presented are representative of two individual experiments. Significance was determined using Student’s t-test (*p < 0.05).
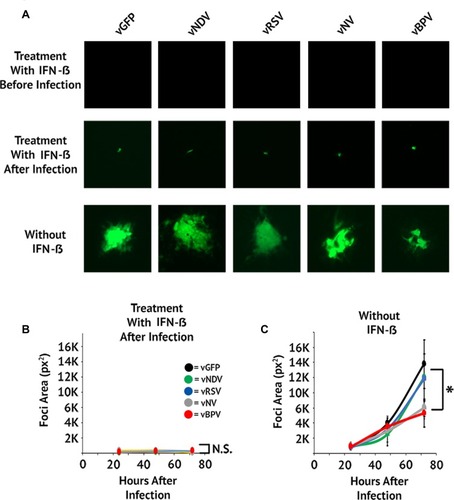
Figure 4 Fusogenic MYXV’s retain their IFN mediated cancer tropism. (A) MEF cells were infected at an MOI of 0.001. Cells were treated with IFN-β either 1-hr pre-infection or 1-hr post-infection. Images of GFP+ foci were then taken at 24, 48, and 72 hrs post-infection. (B and C) Size of individual foci were quantitated using ImageJ software. Data presented are representative of two individual experiments. Significance was determined using Student’s t-test (*p < 0.05).

Figure 5 Fusogenic MYXV’s display reduced therapeutic potential in vivo. C57/Bl6 mice bearing A9F1 tumors were treated with three IT injections of the indicated viral constructs (n=10 or 11 per group). (A) Area of tumors from individual mice over time. Vertical red line marks the euthanasia of the last mock-treated animal and is included for reference. (B) Average tumor burden on day 31 (the day the last mock-treated animal was euthanized). (C) Survival of mice treated with fusogenic constructs. (D) Amount of infectious virus present in tumors 24 hrs after the last viral treatment. Data shown represent the summation of two individual experiments. Significance was determined using Student’s t-test (**p < 0.01, ***p < 0.001).
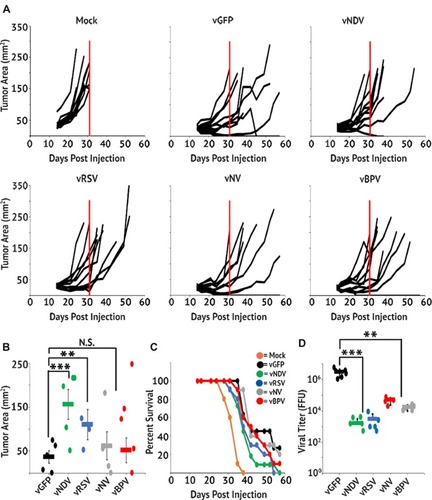
Figure 5 Fusogenic MYXV’s display reduced therapeutic potential in vivo. C57/Bl6 mice bearing A9F1 tumors were treated with three IT injections of the indicated viral constructs (n=10 or 11 per group). (A) Area of tumors from individual mice over time. Vertical red line marks the euthanasia of the last mock-treated animal and is included for reference. (B) Average tumor burden on day 31 (the day the last mock-treated animal was euthanized). (C) Survival of mice treated with fusogenic constructs. (D) Amount of infectious virus present in tumors 24 hrs after the last viral treatment. Data shown represent the summation of two individual experiments. Significance was determined using Student’s t-test (**p < 0.01, ***p < 0.001).
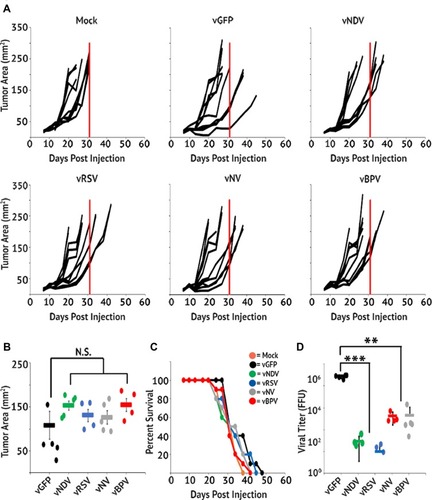
Figure 6 Reduced viral persistence is not mediated by immune clearance. Immune deficient NOD/Scid mice bearing A9F1 tumors were treated with three IT injections of the indicated viral constructs (n=10 or 11 per group). (A) Area of tumors from individual mice over time. Vertical red line marks the euthanasia of the last mock-treated animal and is included for reference. (B) Average tumor burden on day 31 (the day the last mock-treated animal was euthanized). (C) Survival of mice treated with fusogenic constructs. (D) Amount of infectious virus present in tumors 24 hrs after the last viral treatment. Data shown represent the summation of two individual experiments. Significance was determined using Student’s t-test (**p < 0.01, ***p < 0.001).

Figure 6 Reduced viral persistence is not mediated by immune clearance. Immune deficient NOD/Scid mice bearing A9F1 tumors were treated with three IT injections of the indicated viral constructs (n=10 or 11 per group). (A) Area of tumors from individual mice over time. Vertical red line marks the euthanasia of the last mock-treated animal and is included for reference. (B) Average tumor burden on day 31 (the day the last mock-treated animal was euthanized). (C) Survival of mice treated with fusogenic constructs. (D) Amount of infectious virus present in tumors 24 hrs after the last viral treatment. Data shown represent the summation of two individual experiments. Significance was determined using Student’s t-test (**p < 0.01, ***p < 0.001).