
Figures & data
Table 1 Baseline participant characteristics
Figure 1 Self-reported adherence at 8, 12, and 24 weeks for each adherence definition.
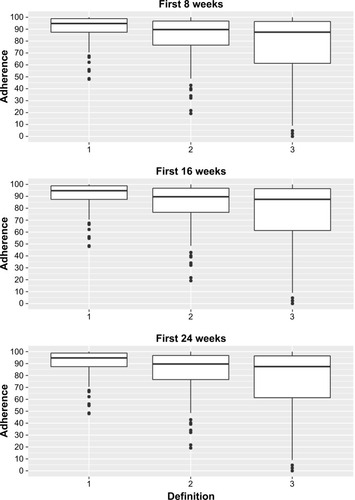
Table 2 Self-reported adherence of participants providing biomarker data using 3 different definitions of adherenceTable Footnotea
Figure 2 Change in baseline in levels of CoQ10 and Alpha-Tochopherol at 8, 16, and 24 weeks.
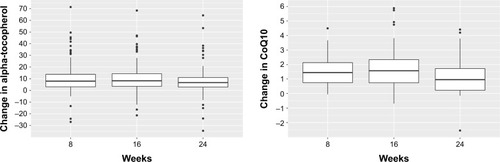
Figure 3 Change in CoQ10 versus change in Alpha-Tochopherol at 8, 16 and 24 weeks in the CoQ10 intervention arm.
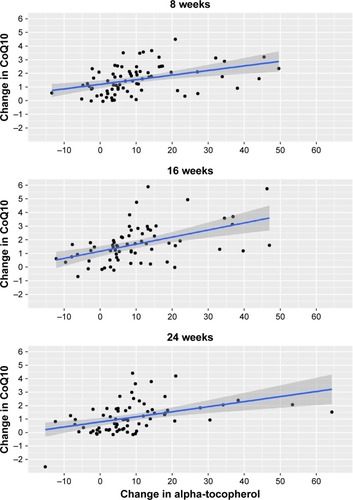
Table 3A Correlation between biomarker changes and self-reported adherence
Table 3B Correlation between biomarker changes and self-reported adherence 1 and 2 weeks prior to blood draw
Figure 4 Change in Alpha-Tocopherol and CoQ10 versus self-reported adherence.
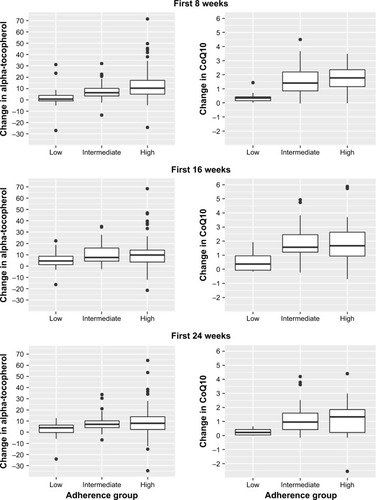
Table 4 Change in alpha-tocopherol and CoQ10 levels by self-reported adherence