
Figures & data
Table 1 Characteristics of the questionnaires
Table 2 Characteristics of study population
Table 3 Patient quotes from the interviews (n=10)
Figure 1 Patients’ experiences with using the creatinine and blood pressure device at follow-up.
Notes:
aHaving access to a creatinine device is pleasant/reassuring/useful; bI have trust in the accuracy of the creatinine/blood pressure meter; cOn a scale of 1 (unpleasant/not reassuring/useless/totally disagree) to 5 (pleasant/reassuring/useful/totally agree).
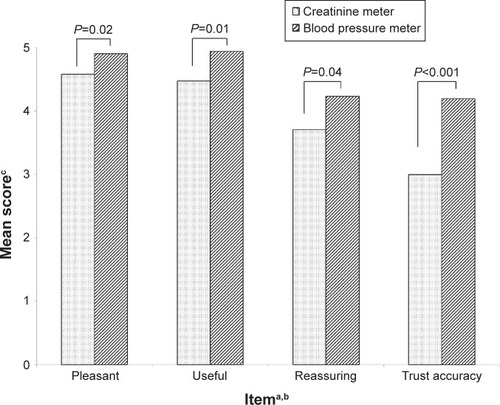
Table 4 Experience of advantages and disadvantages of self-monitoring at baseline and follow-up
Figure 2 Percentage adherence to measurement frequency per protocol.
Notes:
*Measurement frequency: week 1–3, daily; week 4–6, every other day; week 7–9, twice a week; week 10–12, weekly.
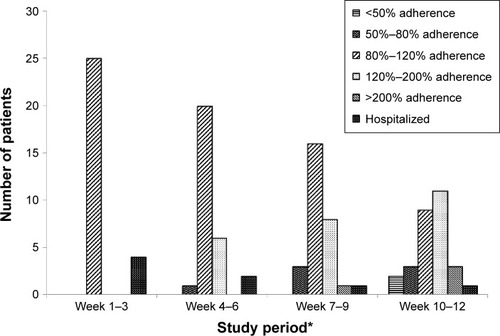
Figure S1 Study flowchart.
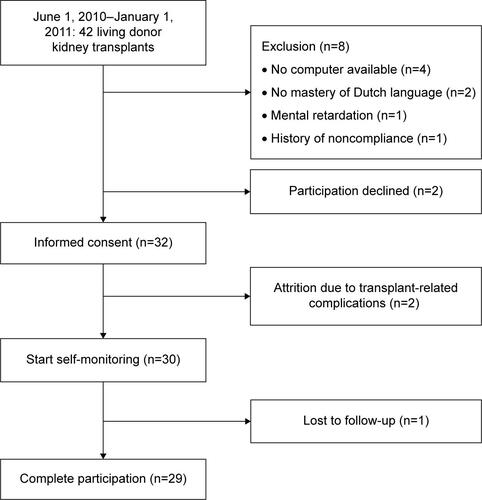
Table S1 Interview protocol