
Figures & data
Figure 1 Orthosteric inhibition of a protein–protein interaction versus allosteric inhibition.
Notes: An orthosteric inhibitor (represented as a purple rectangle) interferes directly with the protein–protein interface, disrupting binding, whilst an allosteric inhibitor (represented as a green triangle) induces a conformational change to the binding interface region of the protein that indirectly disables binding.
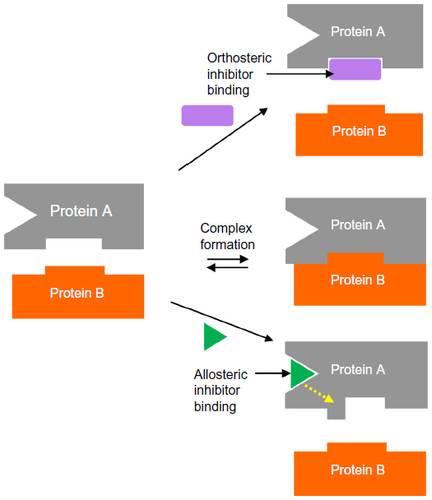
Figure 2 Protein–protein interaction hot spots and allosteric sites.
Notes: (A) Protein–protein interface of the third baculoviral IAP repeat (BIR3) of XIAP and caspase-9 (PDB code = 1NW9), with hot spots computed by the HotRegion webserver (http://prism.ccbb.ku.edu.tr/hotregion/) colored red against the otherwise grey surface. The cartoon representations of BIR3-XIAP and caspase-9 are colored gray and purple, respectively. (B) The allosteric site of HCV NS3 (PDB code = 1CU1) is shown as a molecular surface and colored orange. The protease domain, the NS4a cofactor, and the helicase domain are highlighted in green, magenta, and cyan, respectively. The allosteric site is located at the interface between the protease and helicase domains. Figure prepared using PyMOL Molecular Graphics System, Version 1.2r2; Schrödinger, LLC, Camberley, UK.
Abbreviations: HCV, hepatitis C virus; IAP, inhibitors of apoptosis; PDB, Protein Data Bank.
Abbreviations: HCV, hepatitis C virus; IAP, inhibitors of apoptosis; PDB, Protein Data Bank.
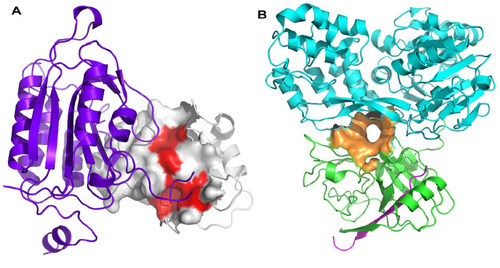
Figure 3 Summary of selected properties and characteristics of fragment hits against PPI targets compared with fragment hits against typical enzyme targets (Std).
Notes: All descriptors were computed using Molecular Operating Environment (MOE), 2013.08; Chemical Computing Group Inc., Montreal, Canada. (A) Acid, base, and hydrophobicity statistics for the two sets of fragment hits. Hydrophobic proportion of molecules was calculated as (hydrophobic atom count)/(heavy atom count). (B) Mean statistics over both datasets of fragments including MWT (Da), logP, molecular globularity, normalized principal moments of inertia ratios (NPR1 and NPR2), TPSA (Å2), number of rotatable bonds, LE, and LLE. (C) Histogram plot (y-axis is percentage of dataset) showing MWT (Da) distribution across both sets of fragments. The blue line represents the PPI fragment hits, and the red line shows the non-PPI, standard fragment hits. (D) Histogram plot (y-axis is percentage of dataset) showing logP distribution across both sets of fragments. The blue line represents the PPI fragment hits, and the red line shows the non-PPI, standard fragment hits. (E) Histogram plot (y-axis is percentage of dataset) showing molecular globularity distribution across both sets of fragments. The blue line represents the PPI fragment hits, and the red line shows the non-PPI, standard fragment hits. (F) Normalized principal moments of inertia ratios plot (NPR1 versus NPR2) showing a measure of the three-dimensional character of both datasets. Blue dots represent the PPI fragment hits, and red dots represent the non-PPI fragment hits. Disk-like structures should cluster towards the bottom apex of the triangular plot, rod-like structures towards the top left and spherical structures to the top right.
Abbreviations: LE, ligand efficiency; LLE, lipophilic ligand efficiency; MWT, molecular weight; PPI, protein–protein interaction; Std, standard; TPSA, topological polar surface area.
Abbreviations: LE, ligand efficiency; LLE, lipophilic ligand efficiency; MWT, molecular weight; PPI, protein–protein interaction; Std, standard; TPSA, topological polar surface area.
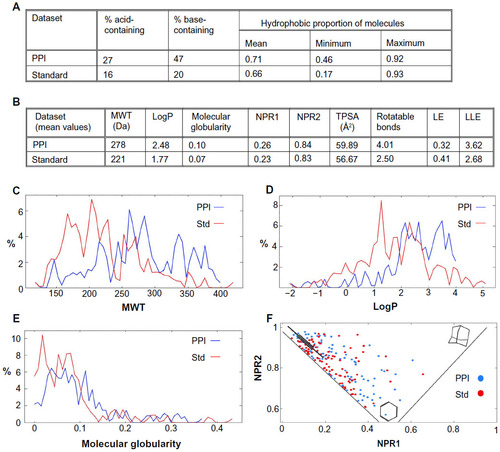
Table 1 Major screening and validation techniques used to detect PPI fragment hits
Table 2 Initial fragment hits and current leads for protein–protein interaction case studies