Figures & data
Table 1 Patient’s Demographics, Malignancy Characteristics and Chemotherapy Regimens of the Selected Population
Table 2 Neutrophil Percentage, Absolute Neutrophil Count, and Absolute Neutrophil Count Difference at Several Days Following the Febrile Neutropenia Attack Treated with G-CSF
Figure 1 The short-term progression of patients with chemotherapy-induced febrile neutropenia (n=80) and subsequently treated with G-CSF illustrated by the daily change in ANC values. Patients were categorized into two groups namely monocytopenia (n=34) and non-monocytopenia (n=46) groups with a cutoff point of 0.1×10⁹ cells/L. Data points are presented as mean ± standard error of the mean (SEM). *P-value ≤ 0.05.
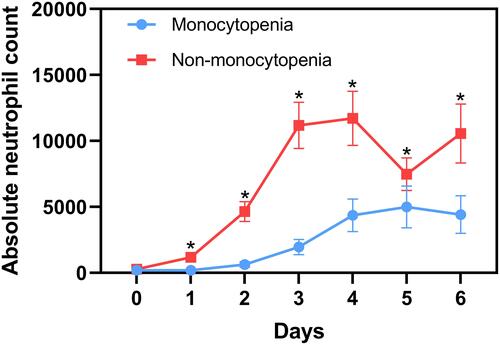
Figure 2 Linear regression analysis evaluated the association between AMC values at admission and ANC values at admission (A) and subsequent follow up days (B). AMC and ANC values were transformed using the natural logarithm (ln).
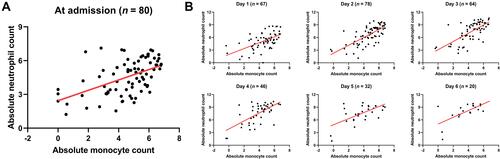
Figure 3 Receiver operating characteristic (ROC) curves of the AMC values at admission for prediction of ANC changes at day 1 to 6 (A-F).
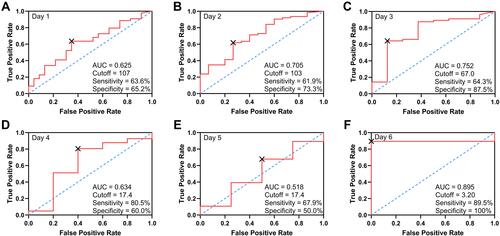
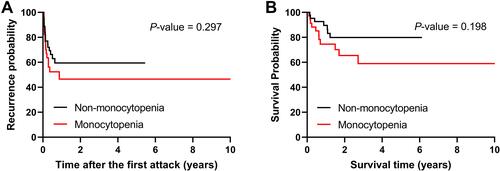
Figure 4 Kaplan–Meier curves to assess the role of monocytopenia in determining the recurrence (A) and survival (B) probability.