
Figures & data
Table 1 General demographic characteristics and thrombosis incidence
Figure 1 Two-dimensional and color Doppler flow imaging (CDFI) of different classifications of peripherally inserted central catheter thrombosis. (A) and (B) No thrombosis, complete compressibility of the vein with smooth vascular lumen. (C) and (D) Class I thrombosis, visible small clumps with low echo in lumen of vein and/or catheter outer wall, CDFI showing good blood flow and a vascular stenosis degree of 1%–30% with slight detectable blood flow. (E) and (F) Class II thrombosis, the presence of thrombosis clot in the vessel lumen and/or catheter outer wall, CDFI showing detectable blood flow and about 31%–50% vascular stenosis. (G) and (H) Class III thrombosis, complete blocking thrombosis with a large part of visible fusion of clot, CDFI showing only part signal of blood flow or no flow signals through narrow channel with vessel cross-sectional stenosis greater than 50%.
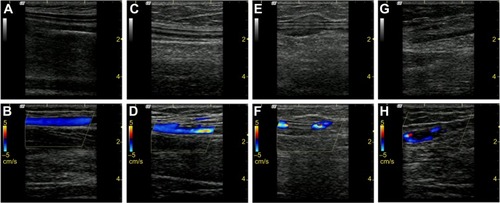
Figure 2 The time distribution between peripherally inserted central catheter (PICC) insertion to the onset of thrombosis.
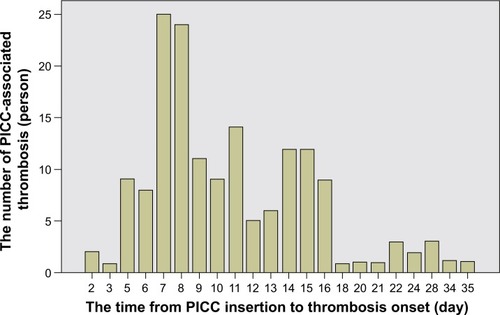
Table 2 The symptoms of peripherally inserted central catheter thrombosis in different classifications
Table 3 Univariable logistic regression analyses for PICC-related thrombosis
Table 4 Multivariable (adjusted) logistic regression analysis of risk factors associated with peripherally inserted central catheter thrombosis