Figures & data
Table 1 Three different centrifugation protocols used to detect microparticles
Figure 1 Detection of circulating microparticles. The microparticle gate was set according to Annexin V binding and size. Particle size was determined by 0.8 μm and 3.0 μm latex beads (beads not shown). TruCount beads were used for quantification (see upper right corner).
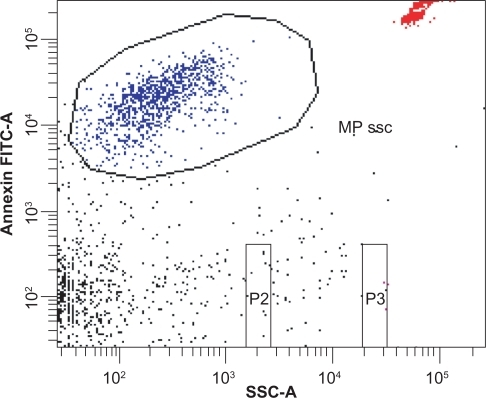
Figure 2 Flow cytometric analysis of three centrifugation protocols. Each centrifugation protocol consisted of two steps as described in . A) An initial centrifugation step at 1500 × g (P3) showed significantly higher microparticle numbers than P1 and P2 at 5000 × g. No significant difference was detected between P1 and P2. There was no significant difference regarding the duration of the second centrifugation step at 17,000 × g (two or 20 minutes, P > 0.05). B) Dot plots, showing that clear separation between debris and Annexin V-positive microparticles was only achieved with P1 and P2, whereas P3 led to an indistinct cutoff (*P < 0.005 comparing protocol P3 with P1 and P2).
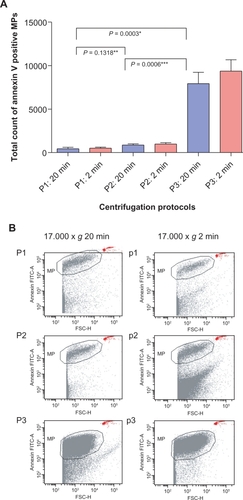
Table 2 MP distribution in centrifugation protocol 1 to 3
Figure 3 Filtration of buffer. The effect of filtered buffer solutions on quantification of microparticles is demonstrated by measuring an equal volume of nonfiltered versus 0.2 μm sterile-filtered buffer. High amount of debris are found in nonfiltered buffer A) compared with that of B) the filtered buffer. TruCount beads (TC) were applied to assay the same volume of buffer exactly.
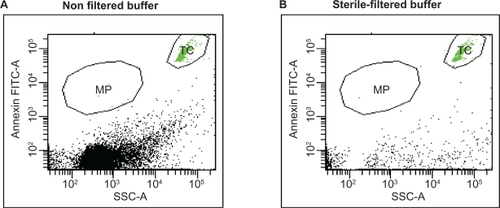
Figure 4 Storage of microparticles. Microparticle number was assayed immediately after preparation (0) and after freezing at −80°c for different periods of time (n = 6).
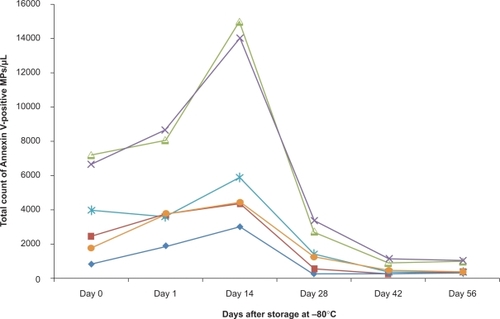
Table 3 Different published centrifugation protocols for detection of MP