Figures & data
Table 1 Baseline characteristics of FLOW cohort of COPD vs referent subjects
Table 2 COPD and the risk of cognitive impairment
Table 3 Relationship between COPD severity and cognitive impairment
Figure 1 Relationship between resting oxygen saturation and the risk of cognitive impairment. Oxygen saturation was measured using pulse oximetry. The LOWESS (locally weighted regression scatter plot smoother) procedure was used to graphically depict the relationship between oxygen saturation and the logit (ie, log odds) of cognitive impairment. This method fitted a flexible smoothed curve that did not impose a linear relationship.
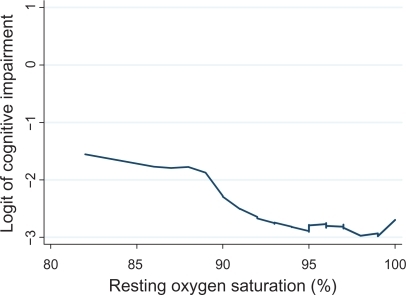
Table 4 Cardiovascular disease and the risk of cognitive impairment in COPD
Table 5 Home oxygen use and the risk of cognitive impairment in COPD