Figures & data
Table 1 Characteristics of nonallergic and allergic groups
Table 2 Methacholine PC50 of conventional respiratory indexes
Figure 1 Responses to sequential exposure of aerosolized saline, maximum concentration of HDM extract, and albuterol. Shown are changes in (A) RR, (B) Cdyn, (C) RL, (D) eBPRL, (E) ePhRL, and (F) PhAng. Responses to saline and HDM were recorded in 23 animals. Albuterol was administered to eight animals exhibiting severe and prolonged increases in airway resistance. The changes were expressed as a percentage of the baseline measurement recorded prior to saline delivery. Values are expressed as means ± SE.
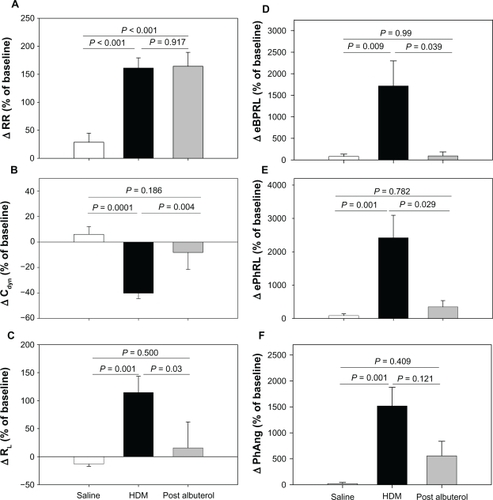
Table 3 Multiple linear regression results of eBPRL, ePhRL, and PhAng recorded during the first 30 minutes following HDM challenge
Figure 2 Representative RIP recordings of one animal (ID: 8065) during both the early asthmatic response and the nocturnal asthmatic response. Excursions of the rib cage (RC) and the abdomen (AB), as well as corresponding eBPRL, ePhRL, and PhAng are shown for multiple breaths. Note the triangular RC and AB wave forms, and that eBPRL and ePhRL are better reflections of TAA than PhAng during the early asthmatic response peak and also are good reflections of TAA during the nocturnal asthmatic response peak. The Konno-Mead diagram (bottom of each vertical panel) shows the direction of RC movement (dRC) and the direction of AB movement (dAB) during inhalation and exhalation in three breaths.
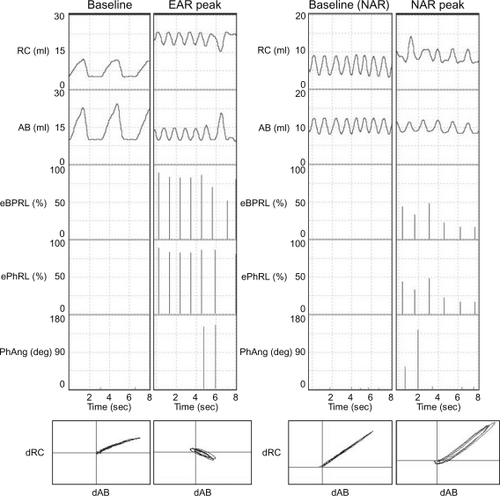
Figure 3 Long-term stability of nocturnal eBPRL and ePhRL. Plots of eBPRL and ePhRL (30-minute averages) starting at 10 pm and ending at 5 am next morning in 11 nonallergic animals. The changes were expressed as a percentage of the baseline measurement recorded during afternoon. Values are means ± SE at each time point.
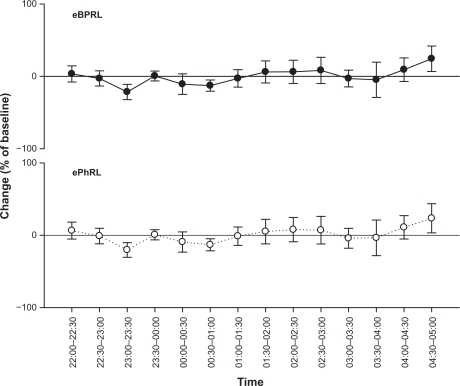
Figure 4 Representative nocturnal eBPRL and ePhRL response of the same animal represented in (ID: 8065). Plot of eBPRL (filled circle) and ePhRL (open circle) (30-minute averages) starting at 1 pm and ending at 6 am next morning. AUC was started at 10 pm and ended at 5 am.
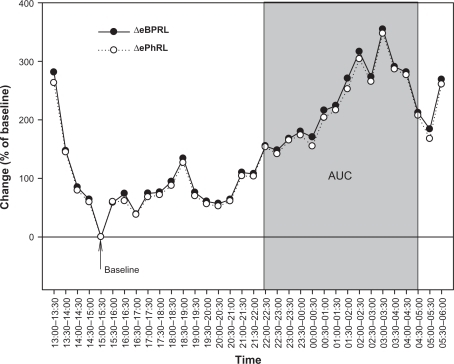
Figure 5 Changes in (A) eBPRL and (B) ePhRL between 10 pm and 5 am for each individual animal in both the allergic group (n = 21) and the nonallergic group (n = 11). A and B the allergic group mean AUC for eBPRL and ePhRL were significantly greater than the nonallergic control group mean AUC. The arrow indicates values for animal ID: 8065 which is also represented in and . Dashed lines represent the upper limit of the 99% confidence interval for the nonallergic group.
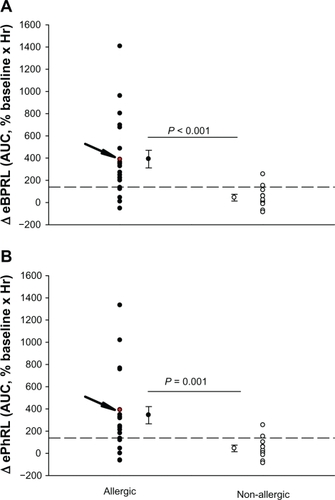
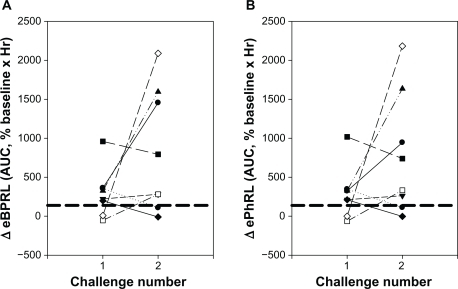
Figure 6 Reproducibility of the nocturnal response to HDM challenge. Eight animals were challenged with HDM on two different dates. AUC for (A) eBPRL and (B) ePhRL are shown. Symbols represent individual animals. Dash lines represent the upper limit of the 99% confidence intervals for the nonallergic group. The symbols above the dashed lines were classified as nocturnal asthmatic responses.