Figures & data
Figure 1 Change in contours in pressure wave (top) and flow wave (bottom) between the ascending aorta and the saphenous artery. Reproduced with permission from Agabiti-Rosei E, Mancia G, O’Rourke MF, et al Central blood pressure measurements and antihypertensive therapy: a consensus document. Hypertension. 2007;50:154–160.Citation4 Copyright © 2007 Lippincott Williams & Wilkins.
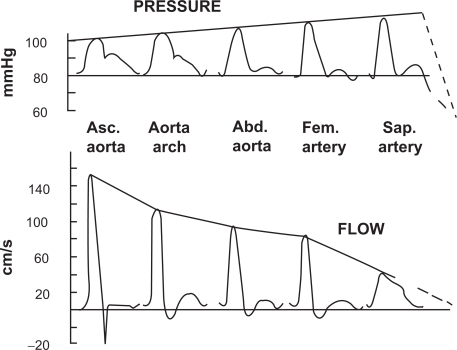
Figure 2 Central pressure waveform. The height of the late systolic peak above the inflection defines the augmented pressure, and the ratio of augmented pressure to pulse pressure identifies the augmentation index (in percent). Reproduced with permission from Agabiti-Rosei E, Mancia G, O’Rourke MF, et al. Central blood pressure measurements and antihypertensive therapy: a consensus document. Hypertension. 2007;50:154–160.Citation4 Copyright © 2007 Lippincott Williams & Wilkins.
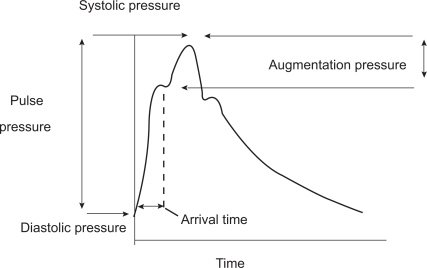
Figure 3 Changes in pulse wave velocity, augmentation index and pulse pressure amplification in 40 hypertensive patients treated with nebivolol or atenolol for 4 weeks. *= p < 0.05; **= p < 0.01 vs Basal. Reproduced by permission from Macmillan Publishers Ltd: Mahmud A, Feely J. Beta-blockers reduce aortic stiffness in hypertension but nebivolol, not atenolol, reduces wave reflection. Am J Hypertens. 2008;21:663–667.Citation34 Copyright © 2008.
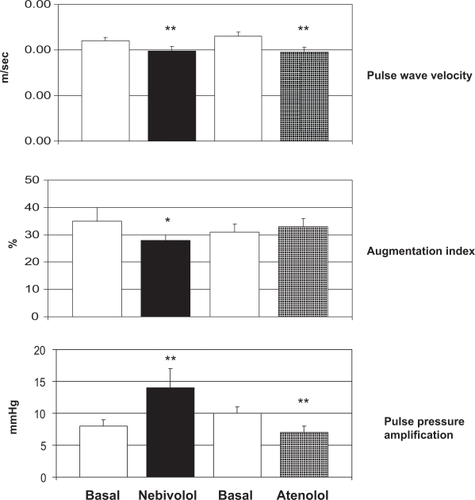
Table 1 Hemodynamic and biochemical parameters following therapy with nebivolol or atenolol