
Figures & data
AE: Adverse event.
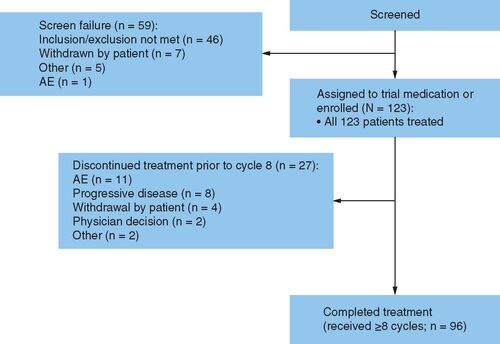
Table 1. Patient demographics and baseline characteristics.
Table 2. Primary safety analysis: number and proportion of patients with prespecified adverse events.
†Confidence interval determined using Wilson score method.
CI: Confidence interval; ECOG PS: Eastern Cooperative Oncology Group performance status.
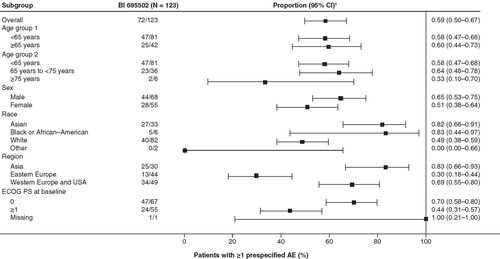
Table 3. Adverse events occurring during the study.
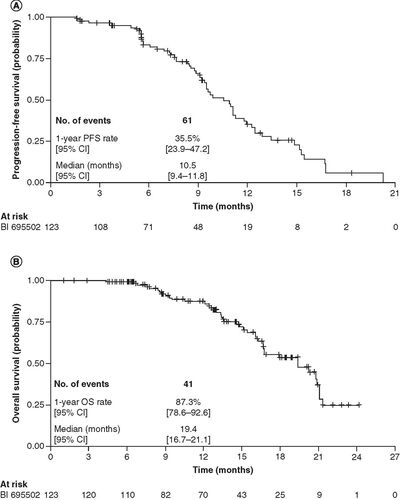
(A) PFS assessed by central imaging review and (B) overall survival.
CI: Confidence interval; OS: Overall survival; PFS: Progression-free survival.
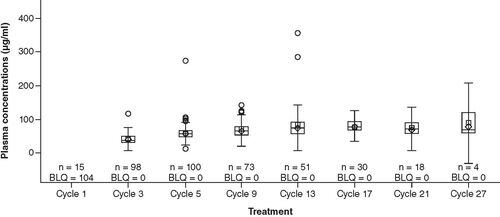
Data shown are the median (horizontal line) within the 25th percentile to 75th percentile box, geometric mean (square) and mean (diamond). The range shown by the ‘whiskers’ is defined by the 25th percentile minus 1.5-times the interquartile range (IQR) and the 75th percentile plus 1.5-times the IQR. Circles represent outlying results.
BLQ: Below the limits of quantification.
Supplementary data
Download MS Word (21.9 KB)Data sharing statement
The authors certify that this manuscript reports original clinical trial data: NCT02776683/2015-003718-25. To ensure independent interpretation of clinical study results and enable authors to fulfill their role and obligations under the ICMJE criteria, Boehringer Ingelheim grants all external authors access to relevant clinical study data pertinent to the development of the publication. In adherence with the Boehringer Ingelheim Policy on Transparency and Publication of Clinical Study Data, scientific and medical researchers can request access to clinical study data after publication of the primary manuscript in a peer-reviewed journal, regulatory activities are complete and other criteria are met. Researchers should use the https://vivli.org/ link to request access to study data and visit https://www.mystudywindow.com/msw/datasharing for further information.