Figures & data
Table 1. Demographic data for colon cancer from Pennsylvania Cancer Registry 1990–2019.
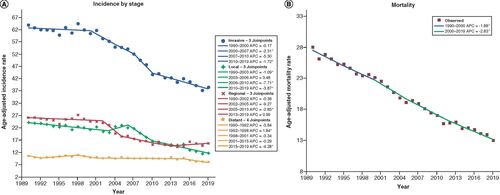
(A) Incidence by stage: age-adjusted incidence rate per 100,000 in Pennsylvania between 1990 and 2019 stratified by stage of cancer at presentation. (B) Mortality: age-adjusted mortality rate per 100,000 from 1990 to 2019.
*Statistical significance at p < 0.05.
APC: Annual percentage change.
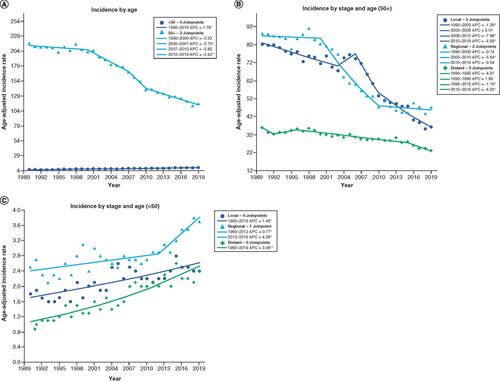
(A) Incidence by age: plotted age-adjusted incidence per 100,000 from 1990–2019 with Joinpoint analysis for patients younger and older than 50 years old. (B) Incidence by stage and age (50+): age-adjusted incidence per 100,000 between 1990–2019 for patients older than 50 years old stratified by stage of disease. (C) Incidence by stage and age (<50): age-adjusted incidence per 100,000 between 1990–2019 for patients younger than 50 years old stratified by stage of disease.
*Statistical significance at p < 0.05.
APC: Annual percentage change.
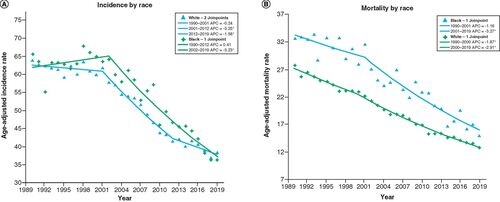
(A) Incidence by race: age-adjusted incidence rate per 10,000 in Pennsylvania between 1990 and 2019 stratified by race. (B) Mortality by race: age-adjusted mortality rate per 100,000 in Pennsylvania from 1990 to 2019 stratified by race.
*Statistical significance at p < 0.05.
APC: Annual percentage change.
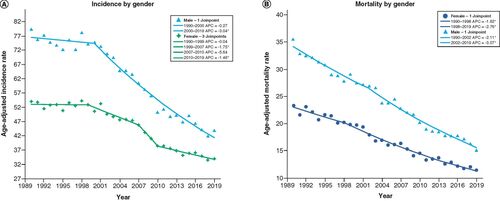
(A) Incidence by gender: age-adjusted incidence rate per 10,000 in Pennsylvania between 1990 and 2019 stratified by gender. (B) Mortality by gender: age-adjusted mortality rate per 100,000 in Pennsylvania from 1990 to 2019 stratified by gender.
*Statistical significance at p < 0.05.
APC: Annual percentage change.
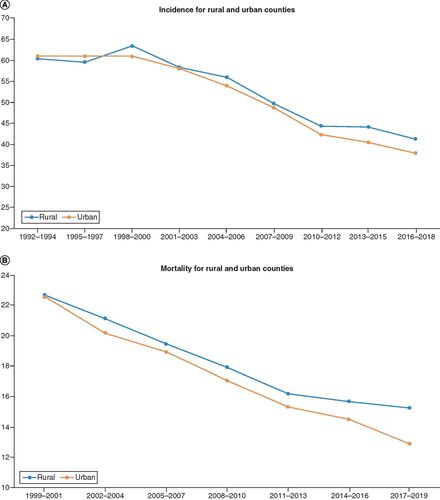
(A) Incidence for rural and urban counties: age-adjusted incidence rate per 10,000 in Pennsylvania stratified by urban and rural counties. (B) Mortality for rural and urban counties: age-adjusted mortality rate per 100,000 in Pennsylvania stratified by urban and rural counties.