964
Views
10
CrossRef citations to date
0
Altmetric
Research Article

The acidosis-induced right shift of the HbO2 dissociation curve is maintained during erythrocyte storage

, , , &
Pages 314-321 | Received 28 Oct 2010, Accepted 13 Feb 2011, Published online: 08 Apr 2011

Figures & data

Figure 1. Changes in P50 values as a function of storage time measured at the four different pH values shown in the figure. All data from 0–17 days of storage represent blood from the same EC bags. The number of EC bags examined after each storage period is shown in italics above the x-axis. Data for all storage periods longer than 2 days were significantly different from day 0. The p values shown as numbers in the figure refer to a difference from the preceding P50 level by a paired T-test including all pH levels. The asterisks denote a significant (*p < 0.05) difference from the preceding value when each individual pH level was analysed separately.
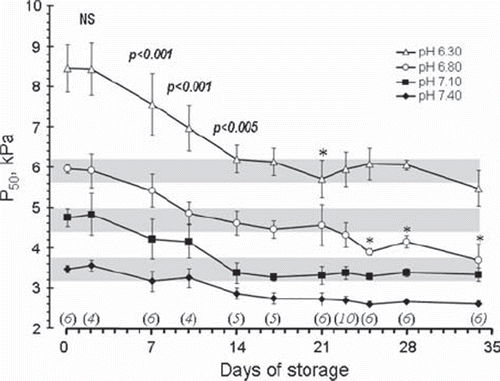
Figure 1. Changes in P50 values as a function of storage time measured at the four different pH values shown in the figure. All data from 0–17 days of storage represent blood from the same EC bags. The number of EC bags examined after each storage period is shown in italics above the x-axis. Data for all storage periods longer than 2 days were significantly different from day 0. The p values shown as numbers in the figure refer to a difference from the preceding P50 level by a paired T-test including all pH levels. The asterisks denote a significant (*p < 0.05) difference from the preceding value when each individual pH level was analysed separately.

Figure 2. Actual HbO2 dissociation curves at 4 different pH values in blood from EC before storage (a) and after storage for 16–17 days (b). Vertical lines are drawn corresponding to PO2 values of 2.7 kPa (critical end-venous level), 5.3 kPa – Low (L), 13.3 kPa – Normal (N) and 20 kPa – High (H). The intersection between these lines and the HbO2 curves are marked with circles, the amount of consumable oxygen given as the ΔSO2 values depicted in the inserts was calculated as exemplified by the method shown for pH = 7.40 and PO2 = 5.3 kPa in both figures.
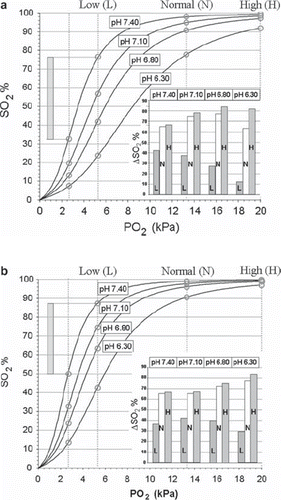
Figure 2. Actual HbO2 dissociation curves at 4 different pH values in blood from EC before storage (a) and after storage for 16–17 days (b). Vertical lines are drawn corresponding to PO2 values of 2.7 kPa (critical end-venous level), 5.3 kPa – Low (L), 13.3 kPa – Normal (N) and 20 kPa – High (H). The intersection between these lines and the HbO2 curves are marked with circles, the amount of consumable oxygen given as the ΔSO2 values depicted in the inserts was calculated as exemplified by the method shown for pH = 7.40 and PO2 = 5.3 kPa in both figures.
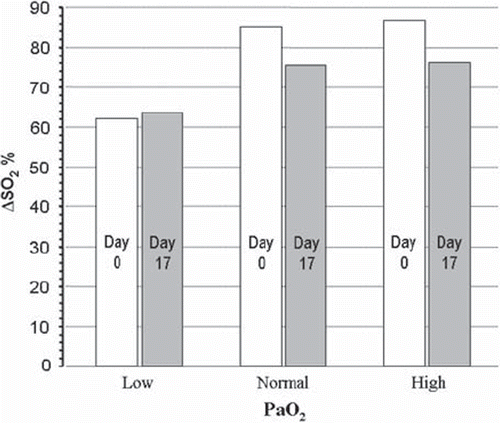
Figure 3. Consumable oxygen, assuming a pH 7.40 in arterial blood and pH 6.80 in the microcirculation, calculated for Low, Normal and High PO2 values as in the inserts in and .

Figure 3. Consumable oxygen, assuming a pH 7.40 in arterial blood and pH 6.80 in the microcirculation, calculated for Low, Normal and High PO2 values as in the inserts in Figure 2a and b.

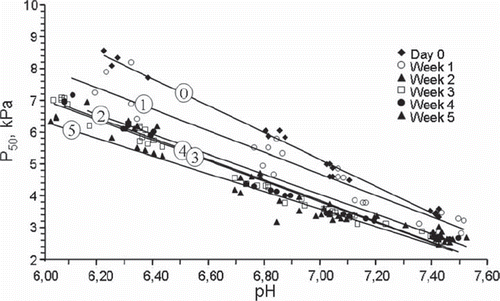
Figure 4. The relationship between pH and P50 values at 0, 1, 2, 3, 4 and 5 weeks of storage shown as a scatterplot, symbols as shown in the figure. The trend lines for each period are numbered corresponding to weeks of storage.

Figure 4. The relationship between pH and P50 values at 0, 1, 2, 3, 4 and 5 weeks of storage shown as a scatterplot, symbols as shown in the figure. The trend lines for each period are numbered corresponding to weeks of storage.