
Figures & data
Table I. Preoperative characteristics of the study cohort (n = 1638).
Table II. Postoperative characteristics of the study cohort (n = 1638).
Table III. Cox multivariate analysis of patients with and without Shrunken Pore Syndrome. (A) Defined by the equation pair CKD-EPIcystatin C and CKD-EPIcreatinine with a cut-off of 60% (i.e. eGFRcystatin C ≤ 0.6 eGFRcreatinine). (B) Defined by the equation pair CAPA and LMrev with a cut-off of 60% (i.e. eGFRcystatin C ≤ 0.6 eGFRcreatinine). (C) Defined by the equation pair CAPA and LMrev with a cut-off of 70% (i.e. eGFRcystatin C ≤ 0.7 eGFRcreatinine).
Figure 1. Calculations using the CKD-EPI formulas based on cystatin C or creatinine. Survival after coronary artery bypass surgery for patients with eGFR > 60 mL/min/1.73 m2 (A) with Shrunken Pore Syndrome (SPS, red broken line) and without (blue solid line). Patients with eGFR< 60 mL/min/1.73 m2 are seen in (B). The cut-off level for SPS was 0.6. For both levels of eGFR: p < 0.001 with log-rank test.
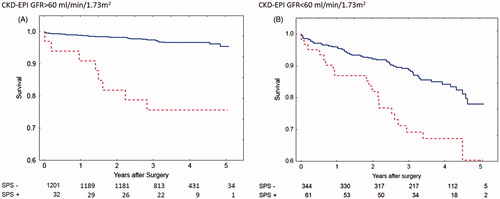
Figure 2. Calculations using the CAPA and LMrev formulas based on cystatin C or creatinine. Survival after coronary artery bypass surgery for patients with eGFR > 60 mL/min/1.73 m2 (A) with Shrunken Pore Syndrome (SPS, red broken line) and without (blue solid line). Patients with eGFR < 60 mL/min/1.73 m2 are seen in (B). The cut-off level for SPS was 0.6. For both levels of eGFR: p < 0.001 with log-rank test.
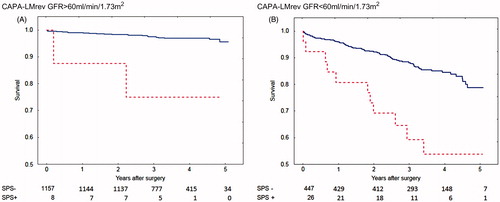
Figure 3. Calculations using the CAPA and LMrev formulas based on cystatin C or creatinine. Survival after coronary artery bypass surgery for patients with eGFR > 60 mL/min/1.73 m2 (A) with Shrunken Pore Syndrome (SPS, red broken line) and without (blue solid line). Patients with eGFR < 60 mL/min/1.73 m2 are seen in (B). The cut-off level for SPS was 0.7. For both levels of eGFR: p < 0.001 with log-rank test.
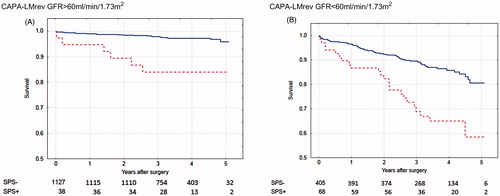
Table IV. Number of patients defined as suffering from ‘Shrunken Pore Syndrome’ by different GFR-estimating equation constellations.