Figures & data
Table I. Biochemical characteristics of 30 children with liver disease.
Figure 1. Age-dependency of GEC in children. Galactose elimination capacity (GEC) in relation to age in 10 healthy children (•; solid line) and 30 children with liver disease (Δ; broken line). The symbols indicate measured values and the lines indicate the fitted regression curves (see text).
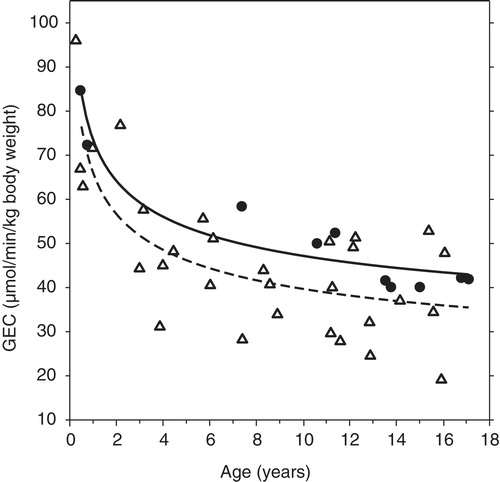
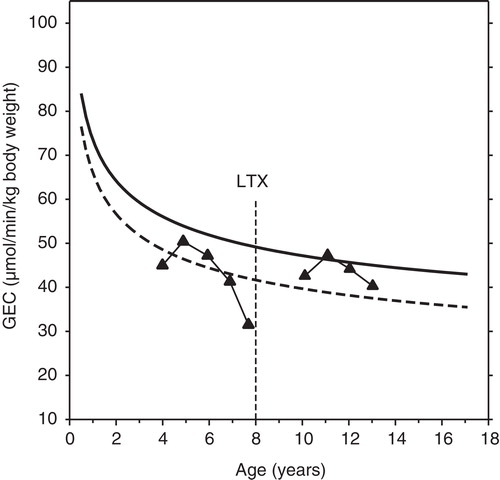
Figure 2. Example of GEC before and after liver transplantation in a child with severe liver disease. In this boy with alpha-1-antitrypsin deficiency the age-dependent decline in GEC was markedly more pronounced than in healthy children. Following liver transplantation at the age of eight his GEC normalized and exhibited a normal age-dependent decline. The symbols connected by straight lines indicate measured values. The regression curves shown for comparison are those illustrated in .