Figures & data
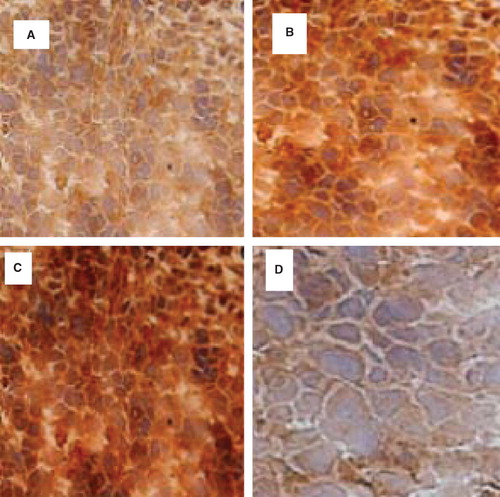
Figure 1. (A) Accumulation of 131I-anti-MIF McAb and 131I-IgG in the hepatocellular carcinoma (HCC) tissues (%ID/g). Values are means ± SD, n = 8 in all groups; *p < 0.05 vs. 131I-IgG. (B) Change of T/NT in the HCC tissues of 131I-anti-MIF and 131I-IgG McAb groups. Values are means ± SD, n = 8 in all groups; *p < 0.05 vs. 131I-IgG. (C) Change of T/B of 131I-anti-MIF McAb and 131I-IgG in HCC tissues. Values are means ± SD, n = 8 in all groups; *p < 0.05 vs. 131I-IgG.
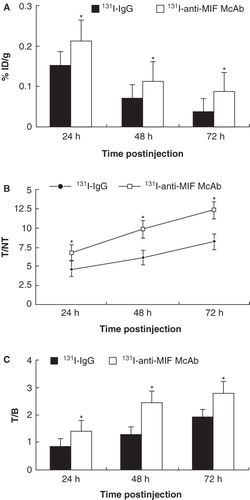
Figure 2. Images of the hepatocellular carcinoma (HCC) mice model. The 131I-anti-MIF McAb group had clear images in accordance with the high T/NT ratio.
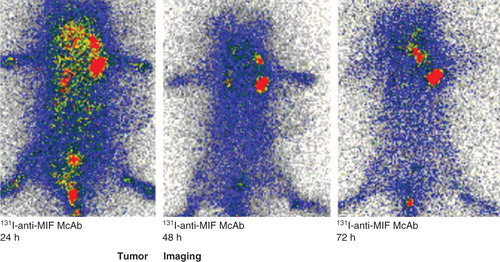
Figure 3. The expression of MIF mRNA in hepatocellular carcinoma (HCC) and healthy liver tissues. There were little changes in MIF gene expression in healthy liver tissues at the three time points. However, there was a twofold increase in MIF mRNA expression in HCC tissues at 24 h compared with healthy liver tissues (p < 0.05). The MIF mRNA levels in HCC tissues were keeping at a high level until 72 h compared with healthy liver tissues (p < 0.05). Semi-quantitative RT-PCR was performed in duplicate to minimize experimental error on the value calculated. All columnar values were expressed as means and standard deviations. A pattern of results was analyzed by repeating at least three times. p < 0.05 compared with the normal group.
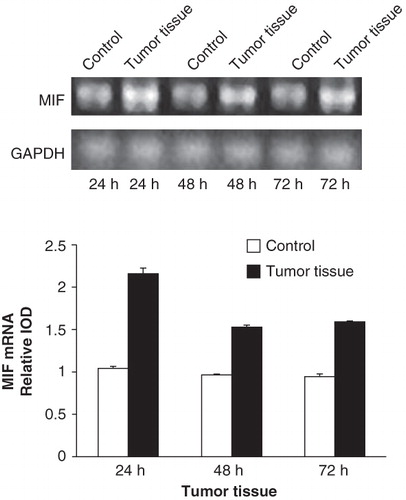
Figure 4. Expression of MIF in vivo. Expression of MIF protein was negative or weakly positive in healthy liver tissues (D). However, there was a significant increase in MIF expression in HCC specimens according to the time after injection in the first 48 h (A and B); and keeping the same level until 72 h (C).