Figures & data
Table I. Patient characteristics.
Table II. Frequency of reactive CD4 T cells after direct cloning from biopsies using two different cut-offs.
Figure 1. Screening of 3972 clones from one CD patient (IBD55). CD4 T cells were isolated from intestinal biopsies and expanded in vitro. The responses to MAP and E. coli was tested in a 3H thymidine incorporation assay using autologous adherent cells as APC. Each symbol represents one tested well. The line indicates the cut-off of a stimulation index >10 (response in antigen stimulated well/response in unstimulated wells). The response to the two bacterial antigens was compared using a binominal test (p = 0.032).
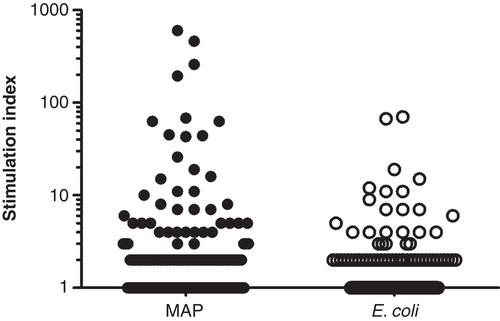
Figure 2. Cytokine secretion in CD4 T cell clones. Production of IFN-γ, IL-10, IL-17 and IL-4 by CD4 T cell clones (n = 20) from two different patients after stimulation with and anti-CD3/anti CD28 beads for IL-10 and IL-4, and PMA/Ionomycin for IL-17 and IFN-γ. The cells were stimulated in duplicates for 24 h. The cytokine production in the supernatant was measured in the Bio-Plex™ assay.
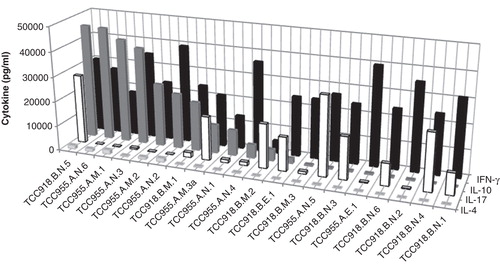
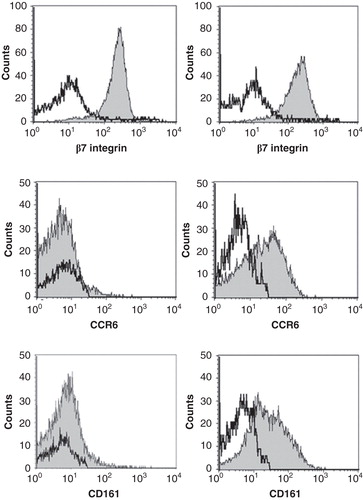
Figure 3. Expression of surface markers in a Th1 clone (left panel) and a Th17/Th1 clone (right panel). The clones were stained with anti-CD4 and then mixed with unstained PBMC to be used as an internal control. The mix was subsequently stained with antibodies against the surface markers β7 integrin, CCR6 and CD161 and analysed by flow cytometry. The negative population of the PBMC for the respective markers were used as an internal control (open histograms) while gating on the CD4+ T cells gave the expression of the various surface markers on the tested clone (grey histograms). Left panels depicts TCC955.M.1 and the right panel TCC958.B.M.1.