Figures & data
Table I. Characteristics of study patients at baseline.
Table II. Alterations in Quality of Life in Reflux and Dyspepsia, Japanese version scores during maintenance therapy.
Figure 1. Percentages of patients who achieved symptom relief in the continuous and on-demand groups according to GOS scores at baseline and at the 4-, 8-, 16-, and 24-week visits. There were no significant between-group differences in the percentage of patients who achieved symptom relief at any visit.
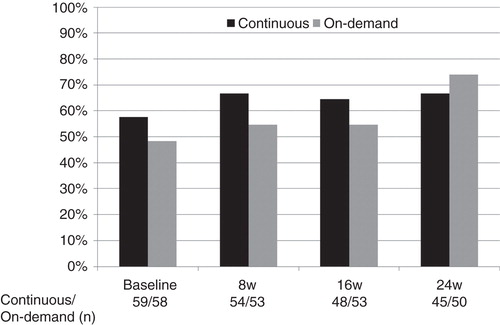
Figure 2. Mean number of consumed tablets per week recorded on a daily chart. Data are shown with standard deviation.
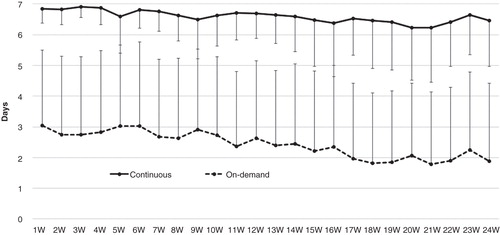
Figure 3. Percentage of patients who were symptom free for 6 or more days a week as recorded on a daily chart. **p < 0.01, *p < 0.05 versus on-demand group.
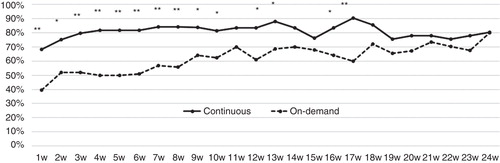
Table III. Patients' characteristics at baseline according to classification of Grade M and Grade ≥ A.
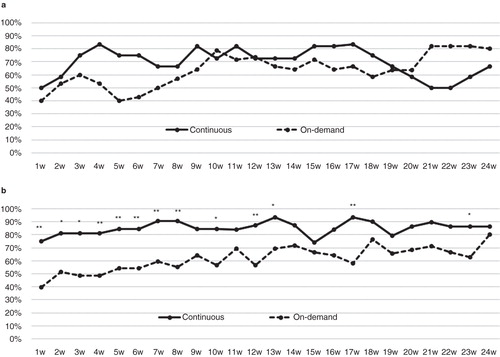
Figure 4. Percentages of patients classified as (a) Grade M or (b) Grade ≥ A who achieved symptom relief in the continuous and on-demand groups according to the GOS. *p < 0.05 versus on-demand group.
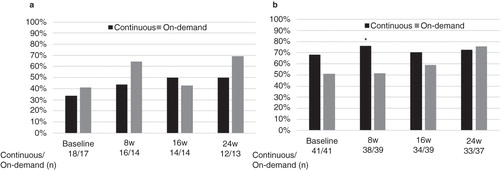
Figure 5. Percentages of patients classified as (a) Grade M or (b) Grade ≥ A who were symptom free for ≥6 days a week in the continuous and on-demand groups according to daily chart entries. **p < 0.01, *p < 0.05 versus on-demand group.