Figures & data
Figure 2. Transversal cross-section of the AMC-4 system/single ring set up of AMC-8 system (A) combined with the R-phantom, the sagittal midplane is indicated with a dotted line. Sagittal cross sections of the AMC-4 system (B) and the AMC-8 system (C, D) with the transversal midplane indicated with a dotted line. The 24 × 24 cm section where E-field measurements were performed shown in is indicated in the sagittal midplane of the R-phantom in (D). For simplicity, all images show AMC-8 ¼λ waveguides (34 × 21 × 12 cm).
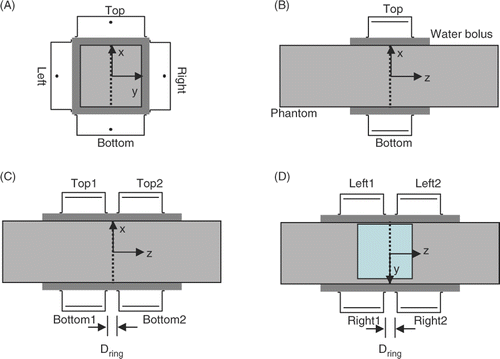
Table I. List of relevant system properties with the performance parameters and phantoms used for evaluating the properties.
Figure 3. Simulations showing the impact of ring distance on the normalised SAR distribution in the sagittal midplane of the R-phantom. Left: AMC-4 system (configuration 1). Right: AMC-8 system (configuration 2) with Dring = 5 (top) and Dring = 11 cm (bottom). SAR normalised to maximum SAR in the focus in each panel, note that the SAR level in the focus is lower for 8 than for 4 waveguides (see text). 50% iso SAR shown in bold.
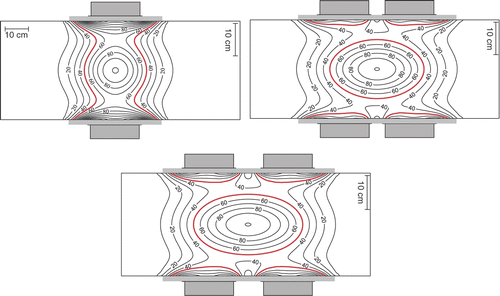
Table II. Configurations used for determining characterisation parameters FWHM, RSratio and Δz for the single ring or two rings set up of the AMC-8 system by using E-field distribution measurements and simulations in the R-phantom. FWHM indicates the size of the focus. RSratio is the normalised ratio between maximum normal tissue SAR and SAR in the focus. The SAR focus shift Δz is a measure for 3-D spatial control. Power settings of every ring are listed as the amplitude ratio between the top, bottom, left, right waveguide (t:b:l:r), respectively, with a total power of 800 W. Phase settings are listed for the top, bottom, left, right waveguide (t,b,l,r), respectively. Phase and amplitude settings of ring 2 of the AMC-8 (two rings) are identical to settings of ring 1, with the phase settings offset with φring and a ring to ring distance Dring. †Simulations only.
Table III. Phase and amplitude settings used for determining system efficiency EFF using SAR distribution measurements and simulations in the E-phantom. Five phase and amplitude settings were used for each of the three systems: AMC-4, AMC-8 (single ring) and AMC-8 (two rings). Power settings of every ring are listed as the amplitude ratio between the top, bottom, left, right waveguide (t:b:l:r), respectively, with a total power of 800 W. Phase settings are listed for the top, bottom, left, right waveguide (t,b,l,r), respectively. Phase and amplitude settings of ring 2 of the AMC-8 (two rings) are identical to the settings of ring 1, with the phase settings offset with φring and a ring to ring distance Dring = 3 cm.
Figure 4. R-phantom simulations of the axial (closed diamonds) and radial (open diamonds) full width half maximum FWHM of the SAR focus as a function of Dring in the AMC-8 system (configuration 2). AMC-4 system (configuration 1) values shown for reference (squares).
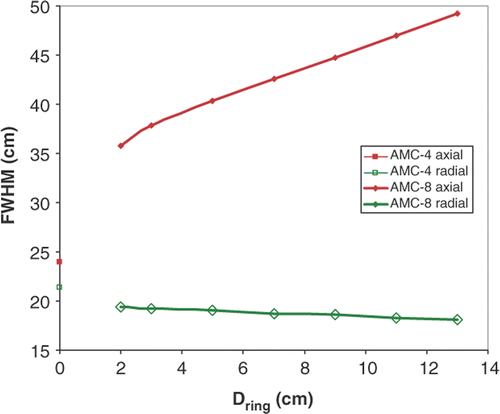
Figure 5. R-phantom simulations of the RSratio for the AMC-8 system (diamonds, configuration 2) as a function of Dring. AMC-4 system (configuration 1) value shown for reference (square).
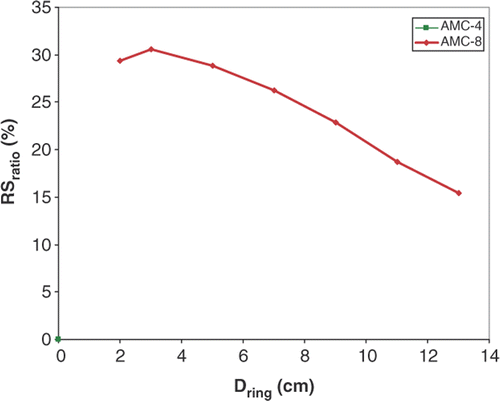
Figure 6. Ez field distributions in the 24 × 24 cm section of the sagittal midplane of the R-phantom in the AMC-8 system shown in for configuration 3. Top row: measured Ez field distributions for φring = 30° (left hand panel), φring = 0° (central panel) and φring = −30° (right hand panel) reconstructed from data on horizontal and vertical tracks shown. The measured focus position zfocus = 6.7 cm for φring = −30°, zfocus = 1.6 cm for φring = 0°, and zfocus = −2.4 cm for φring = 30°. Bottom row: simulated Ez field distributions matching distributions of the top row in arbitrary units, therefore only position and extension of simulated and measured contours may be compared.
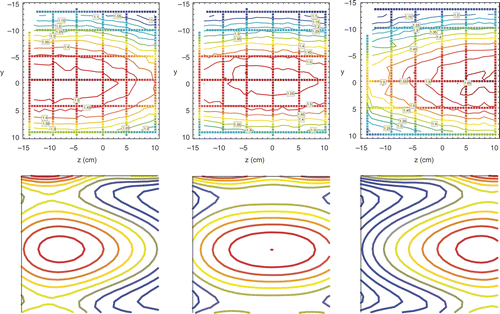
Figure 7. Heating efficiency determined by comparing measured and simulated SAR distributions in the transversal midplane of the E-phantom. Example shown for a single ring of the AMC-8 system for phase and amplitude setting 3 listed in (amplitude 3 : 3 : 2 : 2, phase 0°,0°,45°,45° for top:bottom:left:right). Left: measured SAR distribution in W/kg. Right: simulated SAR distribution in W/kg, an efficiency of 64% was assumed to match the average simulated SAR to the measured SAR data in the central area (r < 10).


