Figures & data
Figure 1. Division of the oxidative phosphorylation system to three subsystems connected by the membrane potential Δψ. JO, flux through the respiratory subsystem; JL, flux through the membrane leak subsystem; JP, flux through the phosphorylation subsystem.
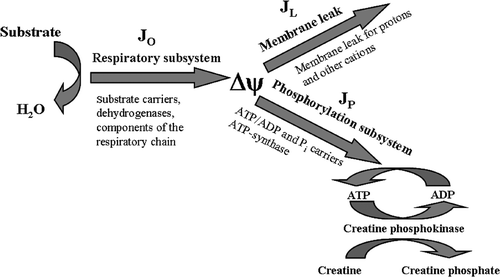
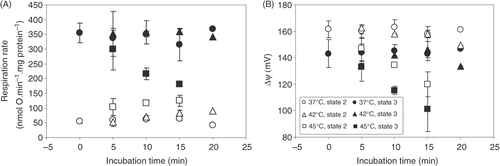
Figure 2. The dependence of state 2 respiration rate (A) and Δψ (B) in heart mitochondria on different incubation temperature and time. Averages from n = 3 independent experiments ± SEM.
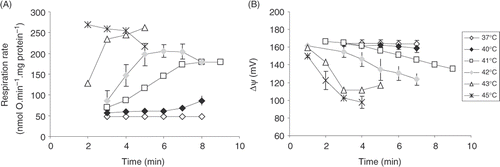
Figure 3. Comparison of the kinetics of the modules of oxidative phosphorylation at 37°C versus 40°C and 37°C versus 42°C. Upper panels (A), (B), (C) represent comparison of inhibitor titration results at 37°C versus 40°C; lower panels (D), (C), (E) at 37°C versus at 42°C. (A), (D), kinetics of the phosphorylation module obtained by titration with rotenone. Phosphorylation flux Jp was calculated as Jp = Jo − JL at the same value of Δψ. (B), (E), kinetics of the respiratory module obtained by titration with carboxyatractyloside. (C), (F), kinetics of the proton leak module obtained by titration with rotenone when ADP phosphorylation is blocked with oligomycin. Averages from n = 3 independent experiments ± SEM. Open symbols, experiments were carried out at 37°C; closed symbols, experiments were carried out either at 40°C (A, B, C) or at 42°C (D, E, F).
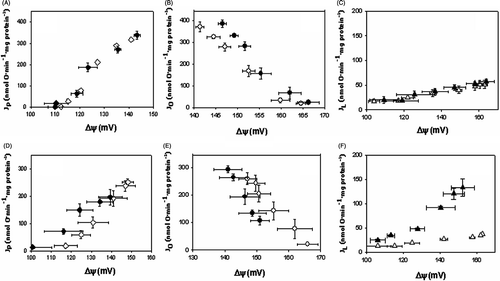
Table I. Effect of increasing the temperature from 37°C to 40°C on the fluxes through the modules of oxidative phosphorylation and the membrane potential. Jo, Jp, JL, the fluxes of respiration, phosphorylation, and proton leak, respectively; Δψ, membrane potential. Averages from n = 3 independent experiments ± SEM. *Statistically significant difference, p < 0.05.
Table II. Effect of increasing the temperature from 37°C to 42°C on the fluxes through the modules of oxidative phosphorylation and the membrane potential. Jo, Jp, JL, the fluxes of respiration, phosphorylation, and proton leak, respectively; Δψ, membrane potential. Averages from n = 3 independent experiments ± SEM. *Statistically significant difference, p < 0.05.
Figure 4. Temperature dependence of ROS production (A) and lipid peroxidation (B) in isolated rat heart mitochondria. Averages from three independent experiments ± SEM; *Statistically significant difference, p < 0.05.
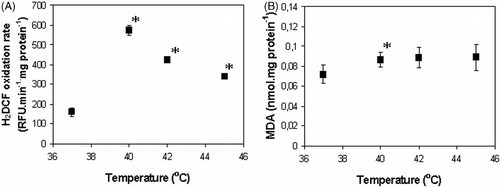
Figure 5. Reversibility of temperature effects on the respiration rate (A) and Δψ (B). Measurements were performed in state 2 and 3 at 37°C after pre-incubation (0–20 min) at 37°, 42° and 45°C. Averages from n = 3 independent experiments ± SEM.