Figures & data
Figure 1. A flow chart of a PID temperature controller simulated using Simulink, Matlab. The simulation program was used to optimise the controller constants, Kd, Kp and Ki using a first order model of RF heating.
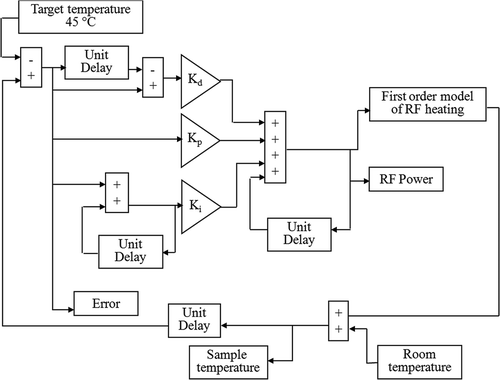
Figure 2. Open-loop temperature curves for SQ and TQF 23Na experiments. The curves were obtained by irradiating the phantom with different constant RF power levels at 400 MHz during SQ and TQF 23Na data collection. The temperature was monitored from the 1H chemical shift of TmDOTA−. The constant RF power (in W) for each curve is shown on right. These curves were fitted to Equation 2 and used to model the RF heating for simulating the PID controller.
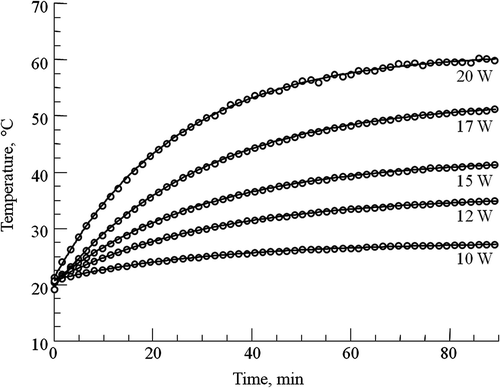
Figure 3. Schematic representation of the placement of the sc implanted 9L-gliosarcoma tumour into the dual tuned slotted tube resonator with an external reference placed near the tumour inside the coil.
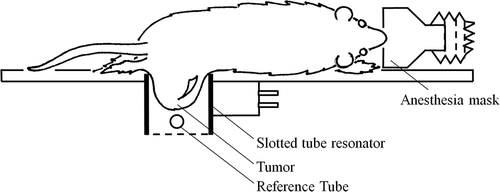
Figure 4. Experimental protocols for (A) SQ and TQF 23Na and (B) 31P MRS data collection during in-magnet controlled RF HT. Separate groups of 9L-gliosarcoma-bearing rats (n = 5) were examined by 23Na and 31P MRS experiments. After collecting eight sets of baseline 1H and 23Na or 31P data, the RF HT was turned on and the tumour was allowed to reach 45°C while continuing the multi-nuclear data acquisition. The RF irradiation was turned off after 30 min of controlled HT at 45°C. The MR data collection was continued for an additional one hour during which time the tumour returned back to the baseline temperature.
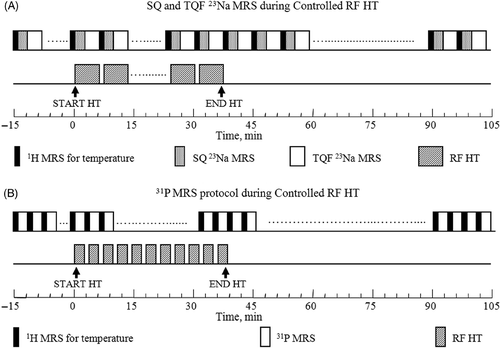
Figure 5. (A) Stacked plot of representative in vivo 1H spectra from H6 of TmDOTA− from sc implanted 9L-gliosarcoma during the controlled RF HT experiment. The chemical shift scale is referenced to the water resonance at 4.7 ppm. As tumour temperature was increased by RF heating, the 1H signal shifted to the left. When the RF was turned off, the signal shifted back to the original position. (B) A plot of tumour temperature calculated from the chemical shift of TmDOTA− and RF power level during the 45°C HT experiment. The PID controller modulated the RF power for heating such that the tumour temperature remained at 45 ± 0.2°C.
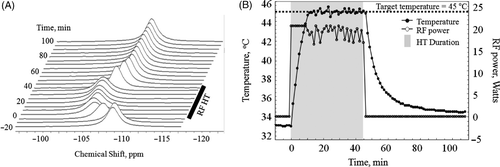
Figure 6. Representative in vivo SQ (left), TQF (middle) 23Na and 31P spectra (right) from sc-implanted 9L-gliosarcoma before (top), at the end of 30 min controlled HT (middle), and after 40 min of HT treatment. SQ and TQF 23Na spectra show peaks from the tumour and the reference containing TmDOTP5-. The chemical shift scale is referenced to tissue 23Na resonance at 0 ppm. 31P spectra show the different metabolite resonances from the tumour, the external reference, MPA, and the pHe probe, 3-APP. The PCr resonance is assigned as 0 ppm.
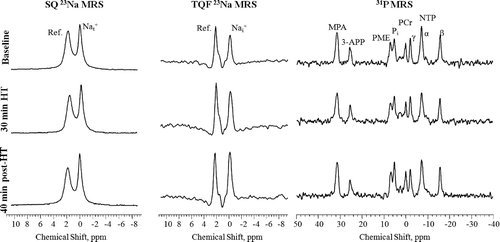
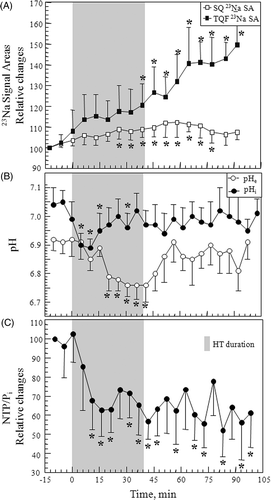
Figure 7. Effects of 45°C HT on (A) SQ and TQF 23Na signal areas (n = 5), (B) pHi and pHe (n = 6), and (C) NTP/Pi (n = 6) in sc implanted 9L-gliosarcoma (mean ± SEM). SQ and TQF 23Na signal areas and NTP/Pi baseline levels were normalised to 100. *p ≤ 0.05 versus pre-HT baseline data.