447
Views
13
CrossRef citations to date
0
Altmetric
Research Article

Severe, short-duration (0–3 min) heat shocks (50–52°C) inhibit the repair of DNA damage

, , , , &
Pages 67-78 | Received 29 Jul 2009, Accepted 15 Oct 2009, Published online: 25 Jan 2010

Figures & data

Figure 1. Temperature profiles in typical experiments. The heating system was set to test four different target temperatures: 38°C (t1), 49°C (t2), 50°C (t3) and 56°C (t4). All curves used media preheated to the indicated target temperature. The 50°C (t3) line shows the temperature transients that occurred when preheated culture medium was aspirated and replaced with 37°C culture media. In view of the long temperature transient, all experiments used preheated culture media.
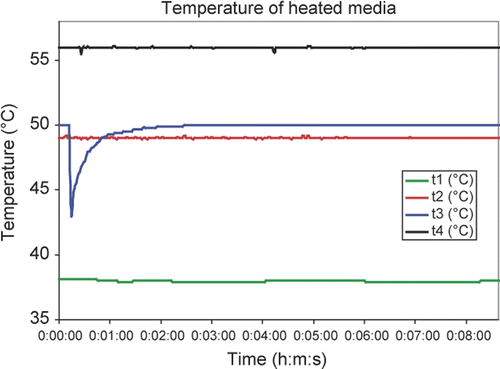
Figure 1. Temperature profiles in typical experiments. The heating system was set to test four different target temperatures: 38°C (t1), 49°C (t2), 50°C (t3) and 56°C (t4). All curves used media preheated to the indicated target temperature. The 50°C (t3) line shows the temperature transients that occurred when preheated culture medium was aspirated and replaced with 37°C culture media. In view of the long temperature transient, all experiments used preheated culture media.

Figure 2. Comet parameters reflecting DNA damage as a function of UV dose. Four comet parameters were tested to determine which showed a linear response with increasing UV exposure. The comet moment, comet length, fraction of DNA in the comet head and total DNA in the comet were measured as described in the text and plotted against UV fluence. The plotted points are the means of at least three experiments and the bars are one standard error of the mean.
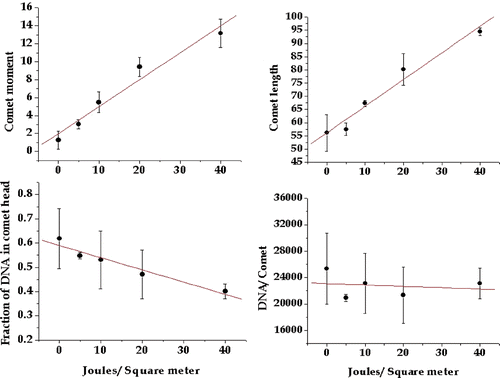
Figure 2. Comet parameters reflecting DNA damage as a function of UV dose. Four comet parameters were tested to determine which showed a linear response with increasing UV exposure. The comet moment, comet length, fraction of DNA in the comet head and total DNA in the comet were measured as described in the text and plotted against UV fluence. The plotted points are the means of at least three experiments and the bars are one standard error of the mean.

Figure 3. Inhibition of DNA damage repair by a 60-s 50°C heat shock. Four comet parameters were tested to determine which showed the effect of repair with increasing time after UV exposure. In addition, the parameters were tested to determine if they could show inhibitory effects of a 60-s 50°C heat shock on the repair of UV-induced DNA damage. The comet moment, comet length, fraction of DNA in the comet head and total DNA in the comet were measured as described in the text. The plotted points are the means of at least three experiments and the bars are one standard error of the mean. The comet parameters for cells not exposed to UV are shown on each graph. Similar results were obtained with 30-s and 15-s 50°C heat shocks except that the levels of DNA repair inhibition were progressively smaller. Data not shown.
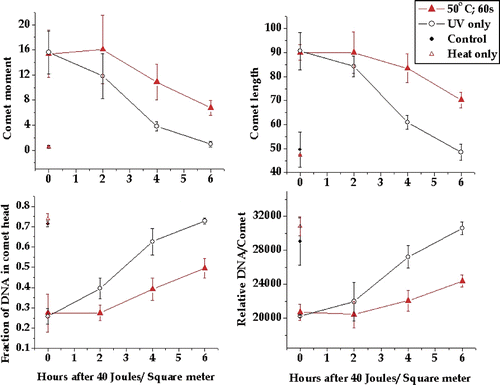
Figure 3. Inhibition of DNA damage repair by a 60-s 50°C heat shock. Four comet parameters were tested to determine which showed the effect of repair with increasing time after UV exposure. In addition, the parameters were tested to determine if they could show inhibitory effects of a 60-s 50°C heat shock on the repair of UV-induced DNA damage. The comet moment, comet length, fraction of DNA in the comet head and total DNA in the comet were measured as described in the text. The plotted points are the means of at least three experiments and the bars are one standard error of the mean. The comet parameters for cells not exposed to UV are shown on each graph. Similar results were obtained with 30-s and 15-s 50°C heat shocks except that the levels of DNA repair inhibition were progressively smaller. Data not shown.

Figure 4. Inhibition of DNA damage repair by a 30-s 50°C heat shock. The comet moment, comet length, fraction of DNA in the comet head and total DNA in the comet were tested to determine if they could detect inhibitory effects of a 30-s 50°C heat shock on the repair of UV-induced DNA damage. The plotted points are the means of at least three experiments and the bars are one standard error of the mean. The comet parameters for cells not exposed to UV are shown on each graph.
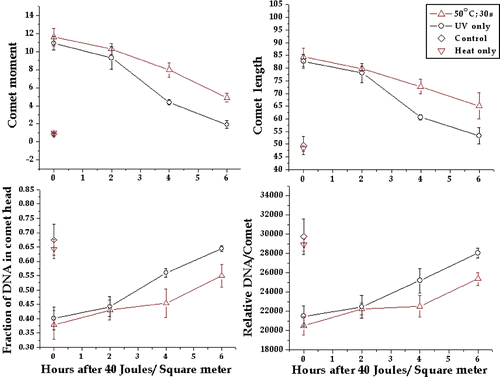
Figure 4. Inhibition of DNA damage repair by a 30-s 50°C heat shock. The comet moment, comet length, fraction of DNA in the comet head and total DNA in the comet were tested to determine if they could detect inhibitory effects of a 30-s 50°C heat shock on the repair of UV-induced DNA damage. The plotted points are the means of at least three experiments and the bars are one standard error of the mean. The comet parameters for cells not exposed to UV are shown on each graph.
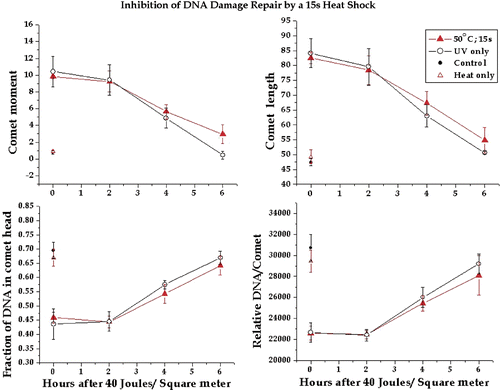
Figure 5. Inhibition of DNA damage repair by a 15-s 50°C heat shock. The comet moment, comet length, fraction of DNA in the comet head and total DNA in the comet were tested to determine if they could detect inhibitory effects of a 15-s 50°C heat shock on the repair of UV-induced DNA damage. The plotted points are the means of at least three experiments and the bars are one standard error of the mean. The comet parameters for cells not exposed to UV are shown on each graph.

Figure 5. Inhibition of DNA damage repair by a 15-s 50°C heat shock. The comet moment, comet length, fraction of DNA in the comet head and total DNA in the comet were tested to determine if they could detect inhibitory effects of a 15-s 50°C heat shock on the repair of UV-induced DNA damage. The plotted points are the means of at least three experiments and the bars are one standard error of the mean. The comet parameters for cells not exposed to UV are shown on each graph.

Figure 6. DNA damage remaining as a function of time after UV exposure. The data shown in along with the results for a 30-s and 15-s heat shock at 50°C (not shown) were converted to percentage damage remaining for each comet parameter measured. The plotted points are the average of the four metrics of DNA damage. The controls have been combined from all three experiments. The error bars are 95% confidence limits. Error bars for the heated samples were omitted for clarity.
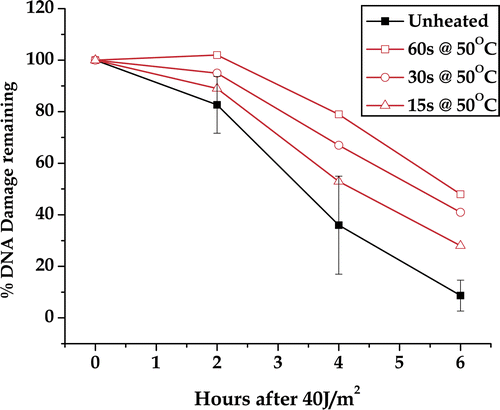
Figure 6. DNA damage remaining as a function of time after UV exposure. The data shown in Figure 3 along with the results for a 30-s and 15-s heat shock at 50°C (not shown) were converted to percentage damage remaining for each comet parameter measured. The plotted points are the average of the four metrics of DNA damage. The controls have been combined from all three experiments. The error bars are 95% confidence limits. Error bars for the heated samples were omitted for clarity.

Figure 7. Dose response in HeLa cells. The relative increase in the indicated UV photoproduct per unit DNA is plotted as a function of UV dose. The points are an average of two or more experiments. When error bars are shown, they represent the standard error for three or more experiments.
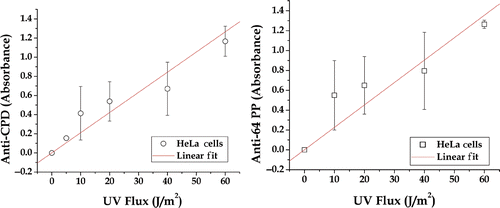
Figure 7. Dose response in HeLa cells. The relative increase in the indicated UV photoproduct per unit DNA is plotted as a function of UV dose. The points are an average of two or more experiments. When error bars are shown, they represent the standard error for three or more experiments.

Figure 8. Repair of UV-induced DNA CDP and 64PP in heat shocked and control HeLa cells. The relative fraction of the indicated UV photoproduct remaining per unit DNA as a function of repair time. The points are an average of three or more experiments ±the standard error.
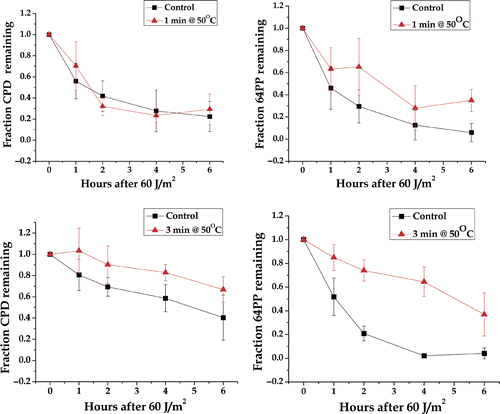
Figure 8. Repair of UV-induced DNA CDP and 64PP in heat shocked and control HeLa cells. The relative fraction of the indicated UV photoproduct remaining per unit DNA as a function of repair time. The points are an average of three or more experiments ±the standard error.

Figure 9. The effects of acute heat shock on radiation-induced γ-H2AX foci. Exponentially growing RKO cells on coverslips were heated at 43° or 50°C and allowed to recover at 37°C for various lengths of time (A) or irradiated with 1 Gy with or without a previous heat shock of 30 sec at 50°C and then allowed to recover at 37°C for various lengths of time (B). At various time points, the coverslips were stained with an anti γ-H2AX antibody (A and B). The number of γ-H2AX foci per cell after irradiation was determined (C).
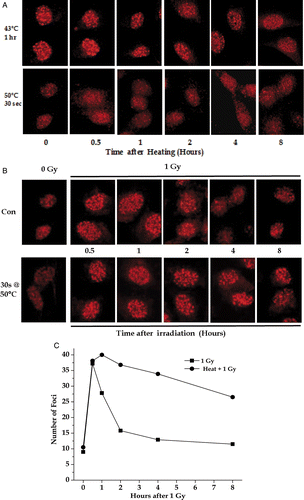
Figure 9. The effects of acute heat shock on radiation-induced γ-H2AX foci. Exponentially growing RKO cells on coverslips were heated at 43° or 50°C and allowed to recover at 37°C for various lengths of time (A) or irradiated with 1 Gy with or without a previous heat shock of 30 sec at 50°C and then allowed to recover at 37°C for various lengths of time (B). At various time points, the coverslips were stained with an anti γ-H2AX antibody (A and B). The number of γ-H2AX foci per cell after irradiation was determined (C).

Reprints and Corporate Permissions

Please note: Selecting permissions does not provide access to the full text of the article, please see our help page How do I view content?

To request a reprint or corporate permissions for this article, please click on the relevant link below:

Academic Permissions

Please note: Selecting permissions does not provide access to the full text of the article, please see our help page How do I view content?

Obtain permissions instantly via Rightslink by clicking on the button below:

If you are unable to obtain permissions via Rightslink, please complete and submit this Permissions form. For more information, please visit our Permissions help page.