Figures & data
Figure 1. (a) Geometry assumed for the tumour (grey region) and for the irradiated surrounding tissue (white region). The dashed circle, with radius R2, represents the transition region surrounding the tumour; (b) a sketch of the actual profile expected for the temperature rise after MNPH treatment.
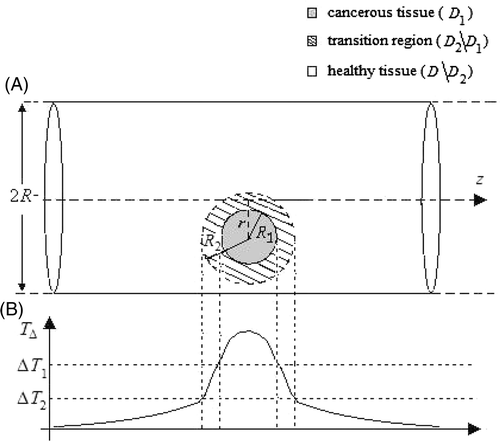
Table I. Numerical results obtained from the proposed criterion.
Figure 2. Temperature distribution produced over the irradiated tissues for cases 3 (A and D), 16 (B and E) and 19 (C and F) reported in . (A–C) Distribution in the plane x–z; (D–E) radial profile in the plane z = 0 for cases 3 and 16, respectively; (F) distribution in the plane z = 0 for case 19.
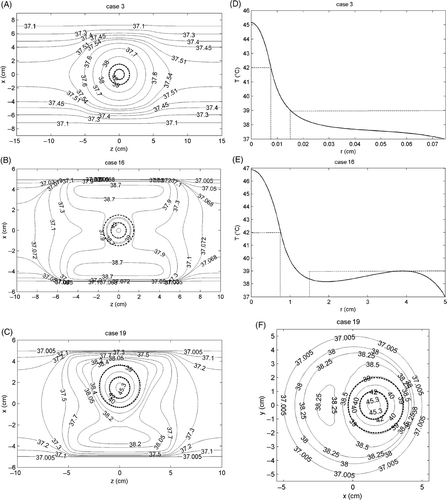
Table II. Optimal values for H, f, d obtained from the value of pm, pe reported in (i.e. cases 3, 7, 16 and 19). For MF amplitudes above 20 kA m−1 Equation 11 is assumed no longer valid.
Figure 3. Contour plot of the behaviour of cmin versus the radius of the tumour, R1, and the radius of the surrounding irradiated tissue, R, for different value of the blood perfusion rate: (A) wb = 0.5 kg m−3 s−1; (B) wb = 1 kg m−3 s−1; (C) wb = 2 kg m−3 s−1; (D) wb = 4 kg m−3 s−1.
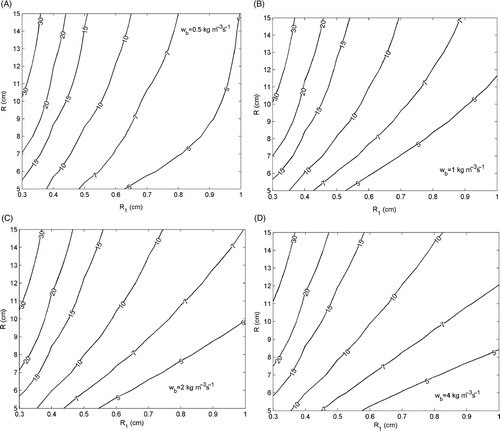
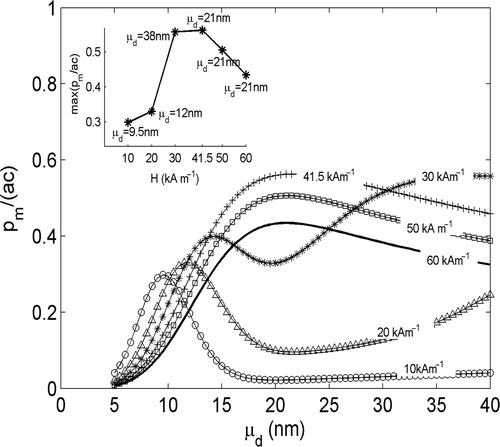
Figure 4. Behaviour of pm/ac (a = 4µ0MRHf) versus μd estimated by using Equation 13 as expression of pm and in the case of polydisperse MNPs. A lognormal distribution, with σd = 0.2, has been assumed. Each curve is relative to a different value of H. The inset reports the maximum values assumed by each curve in figure, versus H and the corresponding values of μd.