Figures & data
Figure 1. A patient with multiple large melanoma lesions on the right leg. The box indicates the radiotherapy target volume. The arrow points to the entrance point of the invasive thermometry probe during treatment 3.
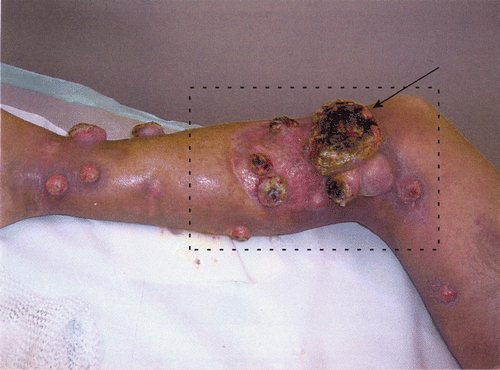
Figure 2. Treatment set-up with CFMA applicators (left) and waveguides (right).
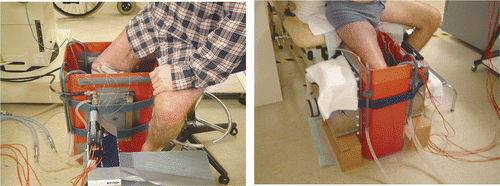
Table I. Applied power per antenna and water bath temperatures for each treatment. Values at the start of treatment as well as the final values are listed.
Figure 3. Schematic representation of the modelled CFMA and waveguide applicator on a fat–muscle geometry. Drawings are not to scale.
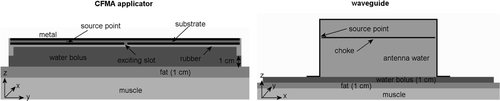
Table II. Dielectric and thermal properties used for the simulations; conductivity (σ [S m−1]), relative permittivity (εr [−]), density (ρ [kg m−3]), specific heat capacity (c [J kg−1°C−1]), thermal conductivity (k [W m−1°C−1]) and perfusion (Wb [mL 100 gr−1 min−1]).
Figure 4. Sagittal and coronal cross sections of the modelled set-up of the leg in a PVC box with CFMA (centre) and waveguide (right) applicators.
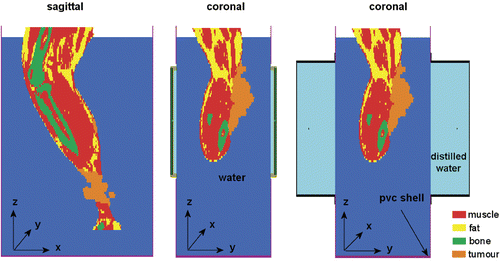
Table III. Indexed steady-state temperatures for all four treatment sessions. Values were determined over all superficial measurement points. Because of the difference in applied power and water temperature for the different treatments, the indexed temperatures are not directly comparable (see text for details).
Figure 5. Average temperatures for each superficial thermocouple probe during treatment 3 (left) and treatment 4 (right). Five superficial thermometry probes were used in treatment 3, and six in treatment 4. The small temperature decrease for two thermocouple probes in treatment 3 after ∼10 min was caused by generator failure of one applicator for ∼5 min. The small temperature decrease in treatment 4 after ∼8 min was caused by replacing a generator. In treatment 3, the water bath temperature was increased after 21 min; in treatment 4 the water temperature was gradually increased after approximately 37 min.
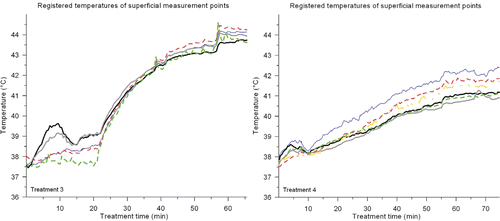
Figure 6. Registered temperatures of the invasive measurement points during treatment 3 (see for the position of the probe). Sensor 1 represents the tip of the thermocouple probe. For clarity, only a selection of the 14 invasive measurement points was plotted.
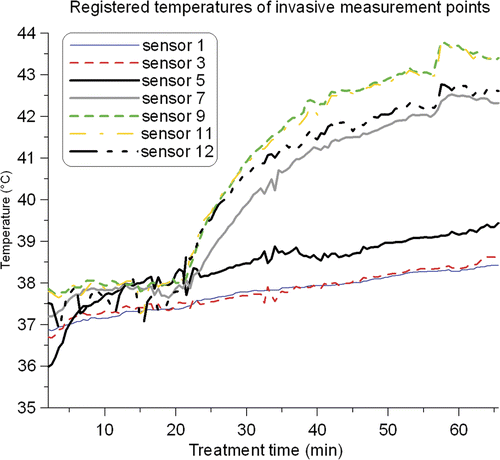
Figure 7. Photograph of the tumour lesions seven weeks after treatment.
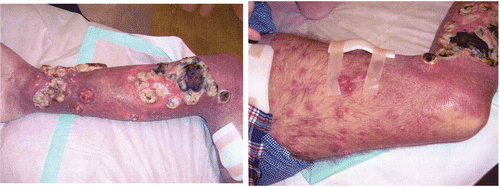
Figure 8. Simulated iso-SAR contours for the CFMA (left) and waveguide (right) applicator in a fat–muscle structure. The plane of these contours is located in muscle, one centimetre below the fat layer.
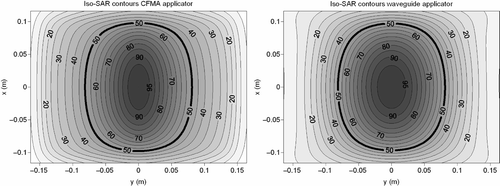
Figure 9. Simulated iso-SAR contours for the CFMA (left) and waveguide (right) applicator in a fat–muscle structure. The plane of these contours is located at the centre of the fat layer, i.e. 0.5 cm from the surface. SAR values were normalised to 100% in muscle, 1 cm below the fat layer (see ).
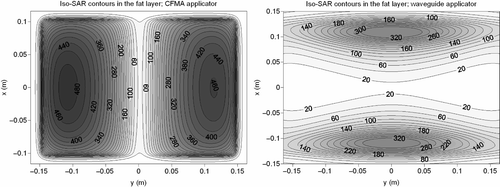
Table IV. Simulated steady-state tumour temperatures for treatments 3 and 4, determined over the complete tumour volume. A constant power and water bath temperature was assumed.
Table V. Average simulated SAR values (W/kg) in tumour, muscle and fat tissue, using CFMA applicators or waveguides.
Table VI. Simulated steady-state temperatures, determined over the complete tumour volume, heterogeneity coefficients and maximum temperatures achieved in tumour, muscle and fat tissue with CFMA applicators and waveguides.
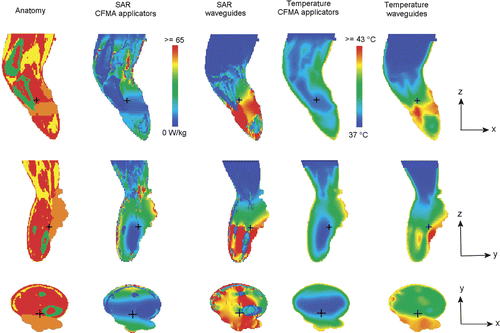
Figure 10. Cross sections of the simulated SAR and temperature distributions with CFMA and waveguide applicators. In both cases, the water bath temperature was 42°C and the absorbed power 200 W in tissue and water bath. The colours red, yellow and green in the anatomy represent muscle, fat and bony tissue, respectively and tumour tissue is orange. The small black cross hair indicates the location of the cross sections.