383
Views
6
CrossRef citations to date
0
Altmetric
Research Article

Experimental study on thermal field in the vicinity of arterial bifurcation in microwave ablation therapy

, , , , &
Pages 316-326 | Received 16 Mar 2009, Accepted 24 Dec 2009, Published online: 08 Mar 2010

Figures & data

Figure 1. Experimental system (A), structure of blood vessel (B).

Figure 1. Experimental system (A), structure of blood vessel (B).

Figure 2. Structure of the antenna and water circulation.

Figure 2. Structure of the antenna and water circulation.

Table I.  Properties of phantom and liver.

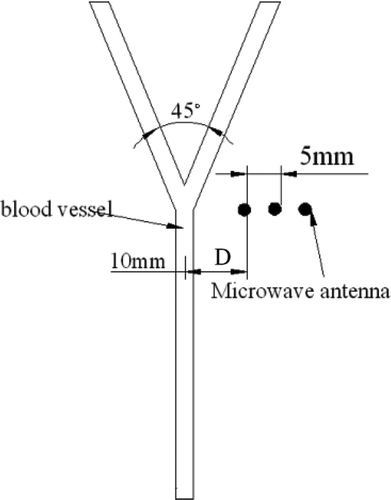
Figure 3. Positions of the microwave antenna.

Figure 3. Positions of the microwave antenna.

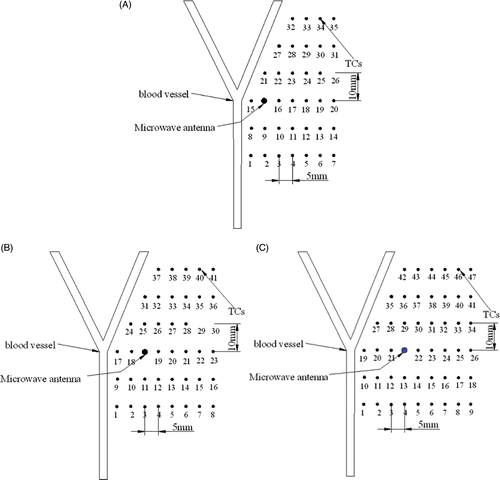
Figure 4. Positions of antenna and TCs. (A) D, 10 mm; (B) D, 15 mm; (C) D, 20 mm.

Figure 4. Positions of antenna and TCs. (A) D, 10 mm; (B) D, 15 mm; (C) D, 20 mm.

Figure 5. Experimental temperature curves for distance between antenna and vessel D = 10 mm (A) TC No.1; (B) TC No.8; (C) TC No.15; (D) TC No.21; (E) TC No.27.
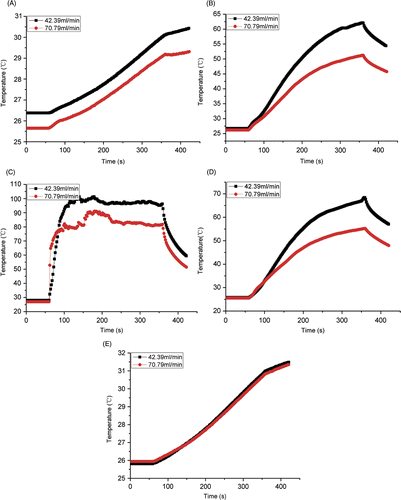
Figure 5. Experimental temperature curves for distance between antenna and vessel D = 10 mm (A) TC No.1; (B) TC No.8; (C) TC No.15; (D) TC No.21; (E) TC No.27.

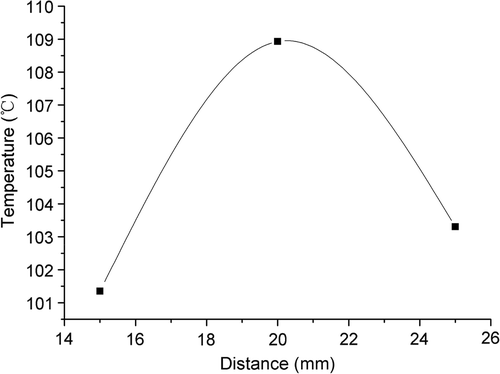
Figure 6. The maximum temperature of the tissue in the recirculation along the branching vessel.

Figure 6. The maximum temperature of the tissue in the recirculation along the branching vessel.

Figure 7. Experimental temperature contours (54°C) after 60 s, 120 s, 180 s, 240 s and 300 s of heating for different distances D between the antenna and the blood vessel with a blood flow of 42.39 mL/min. (A) D = 10 mm; (B) D = 15 mm; (C) D = 20 mm.
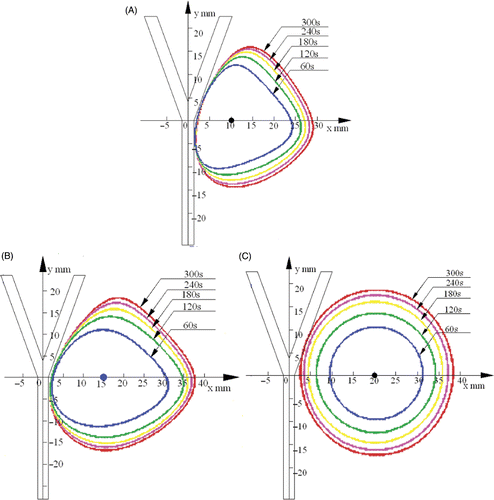
Figure 7. Experimental temperature contours (54°C) after 60 s, 120 s, 180 s, 240 s and 300 s of heating for different distances D between the antenna and the blood vessel with a blood flow of 42.39 mL/min. (A) D = 10 mm; (B) D = 15 mm; (C) D = 20 mm.
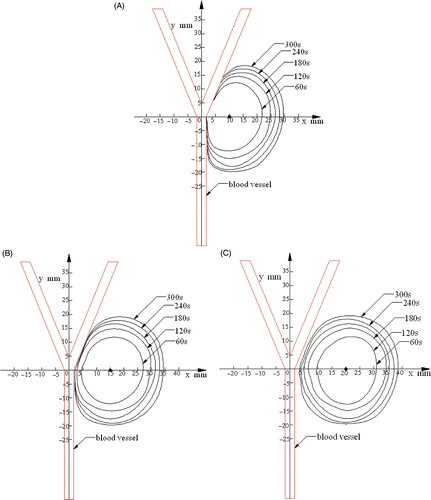
Figure 8. Simulated temperature contours (54°C) for different distances, D, between the antenna and the blood vessel with a blood flow of 42.39 mL/min. (A) D = 10 mm; (B) D = 15 mm; (C) D = 20 mm.

Figure 8. Simulated temperature contours (54°C) for different distances, D, between the antenna and the blood vessel with a blood flow of 42.39 mL/min. (A) D = 10 mm; (B) D = 15 mm; (C) D = 20 mm.

Table II.  Comparison of the coagulation region.

Figure 9. Experimental temperature profiles along the blood vessel for different distances D between the antenna and the blood vessel.
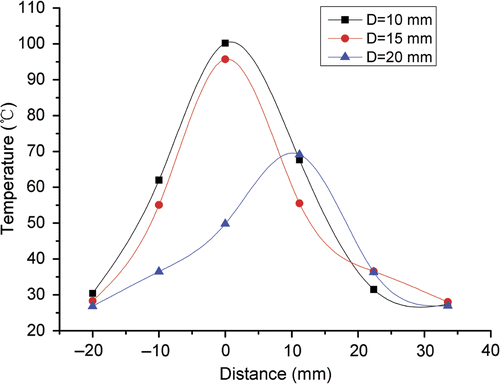
Figure 9. Experimental temperature profiles along the blood vessel for different distances D between the antenna and the blood vessel.

Figure 10. Experimental and simulated temperature profiles along the blood vessel with a blood flow of 42.39 mL/min for D = 10 mm.
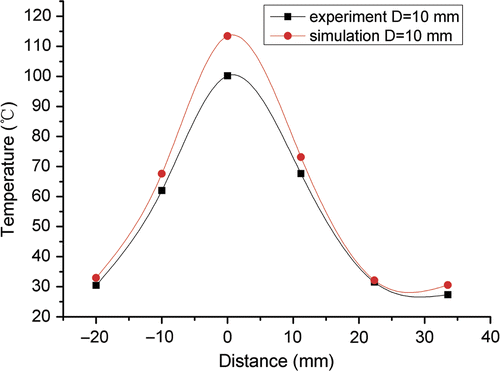
Figure 10. Experimental and simulated temperature profiles along the blood vessel with a blood flow of 42.39 mL/min for D = 10 mm.

Figure 11. Experimental temperature contours (54°C) after 300 s for different distances D between the antenna and the blood vessel with a blood flow of 42.39 mL/min. Position 1: D = 10 mm, Position 2: D = 15 mm, Position 3: D = 20 mm.
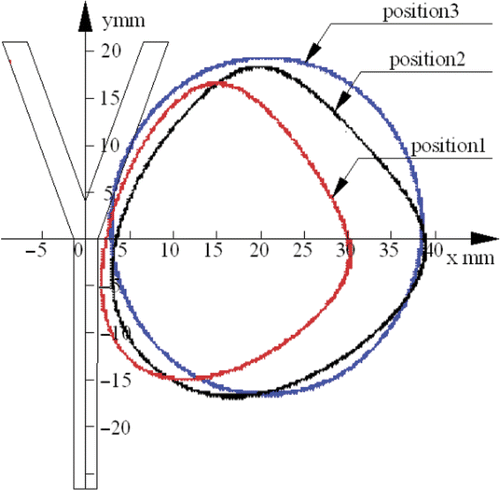
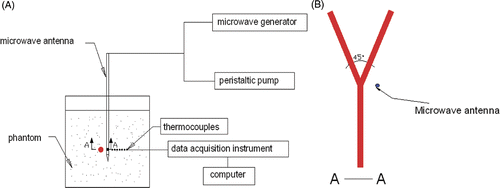
Figure 11. Experimental temperature contours (54°C) after 300 s for different distances D between the antenna and the blood vessel with a blood flow of 42.39 mL/min. Position 1: D = 10 mm, Position 2: D = 15 mm, Position 3: D = 20 mm.
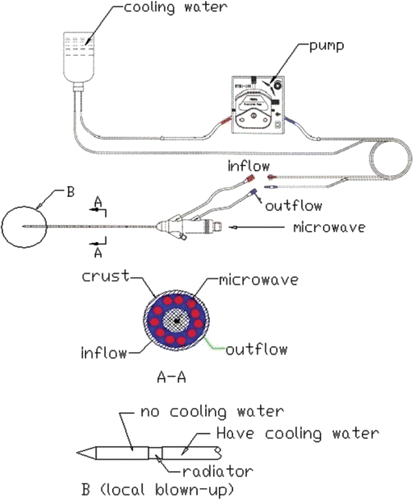
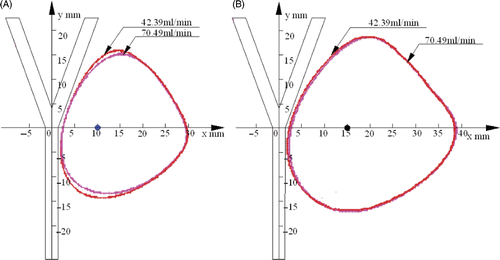
Figure 12. Simulated temperature contours (54°C) after 300 s for different distances D between the antenna and the blood vessel with a blood flow of 42.39 mL/min and 70.79 mL/min. (A) D = 10 mm; (B) D = 15 mm.

Figure 12. Simulated temperature contours (54°C) after 300 s for different distances D between the antenna and the blood vessel with a blood flow of 42.39 mL/min and 70.79 mL/min. (A) D = 10 mm; (B) D = 15 mm.

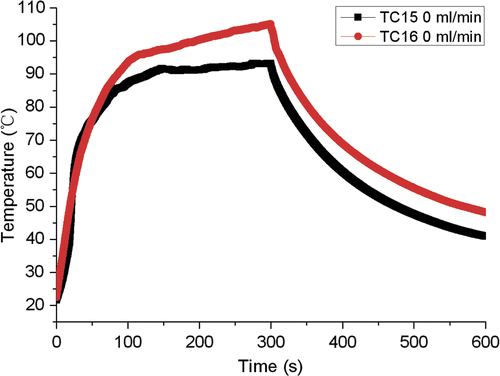
Figure 13. Experimental no-flow temperature of TC No.15 and TC No.16 with D = 10 mm.

Figure 13. Experimental no-flow temperature of TC No.15 and TC No.16 with D = 10 mm.

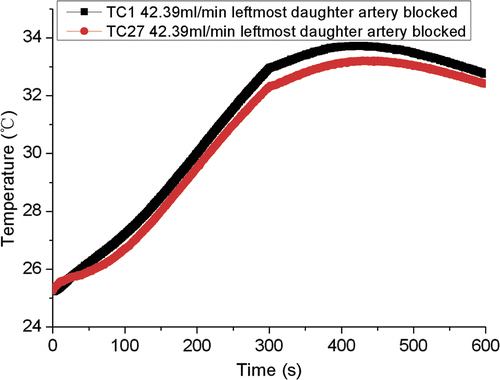
Figure 14. Experimental left-most daughter blocked temperature of TC No.1 and TC No.27 under the condition of 42.39 mL/min with D = 10 mm.

Figure 14. Experimental left-most daughter blocked temperature of TC No.1 and TC No.27 under the condition of 42.39 mL/min with D = 10 mm.

Reprints and Corporate Permissions

Please note: Selecting permissions does not provide access to the full text of the article, please see our help page How do I view content?

To request a reprint or corporate permissions for this article, please click on the relevant link below:

Academic Permissions

Please note: Selecting permissions does not provide access to the full text of the article, please see our help page How do I view content?

Obtain permissions instantly via Rightslink by clicking on the button below:

If you are unable to obtain permissions via Rightslink, please complete and submit this Permissions form. For more information, please visit our Permissions help page.