724
Views
28
CrossRef citations to date
0
Altmetric
RESEARCH ARTICLE

Temperature monitoring utilising thermoacoustic signals during pulsed microwave thermotherapy: A feasibility study

& , PhD
Pages 338-346 | Received 30 Sep 2009, Accepted 04 Jan 2010, Published online: 26 Mar 2010

Figures & data

Figure 1. An experimental set-up schematic of pulsed microwave thermotherapy and in situ temperature monitoring system. The coupling medium between sample and transducer is oil in a plastic bag.
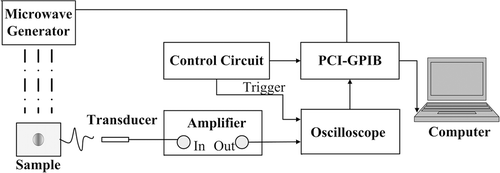
Figure 1. An experimental set-up schematic of pulsed microwave thermotherapy and in situ temperature monitoring system. The coupling medium between sample and transducer is oil in a plastic bag.

Figure 2. Peak thermoacoustic pressure induced in water with various temperatures. The triangle represents experimental data and the circles are the Grüneisen coefficient. The solid line is the fitting curve of experimental data versus temperature while the dashed line is a fit to literature data Citation[31].

Figure 2. Peak thermoacoustic pressure induced in water with various temperatures. The triangle represents experimental data and the circles are the Grüneisen coefficient. The solid line is the fitting curve of experimental data versus temperature while the dashed line is a fit to literature data Citation[31].

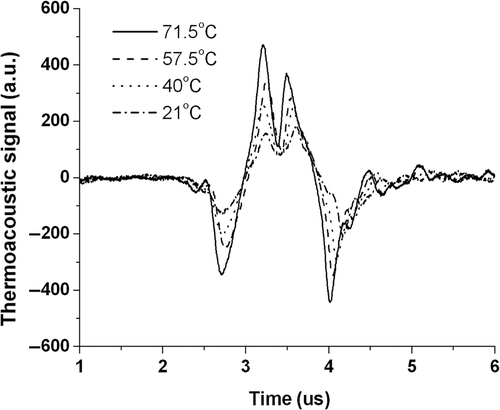
Figure 3. Waveforms of the microwave-induced acoustic pressure for water at various temperatures.

Figure 3. Waveforms of the microwave-induced acoustic pressure for water at various temperatures.

Figure 4. (A, B and C) Dependence of the thermoacoustic pressure on the temperature, which shows goodness fit for linear regression. The test sample was freshly excised pork liver. The PRF is 15 Hz, 25 Hz, 35 Hz, respectively. R2, goodness of fit. (D) Relationship between the rise of temperatures in ex vivo tissue and the pulse repetition frequency. The average power corresponding to the used PRF is 2.7 W, 4.5 W and 6.3 W respectively.
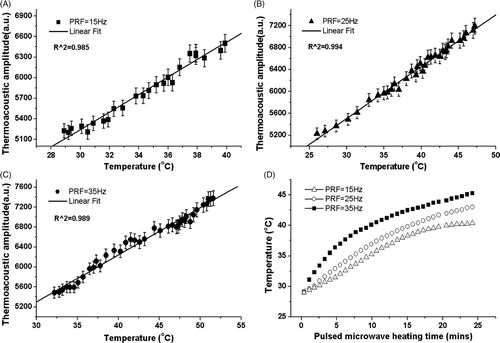
Figure 4. (A, B and C) Dependence of the thermoacoustic pressure on the temperature, which shows goodness fit for linear regression. The test sample was freshly excised pork liver. The PRF is 15 Hz, 25 Hz, 35 Hz, respectively. R2, goodness of fit. (D) Relationship between the rise of temperatures in ex vivo tissue and the pulse repetition frequency. The average power corresponding to the used PRF is 2.7 W, 4.5 W and 6.3 W respectively.

Figure 5. The calculated values (triangle) from thermoacoustic signals versus actual temperature recorded by a digital thermometer. The solid line represents the line of unity.
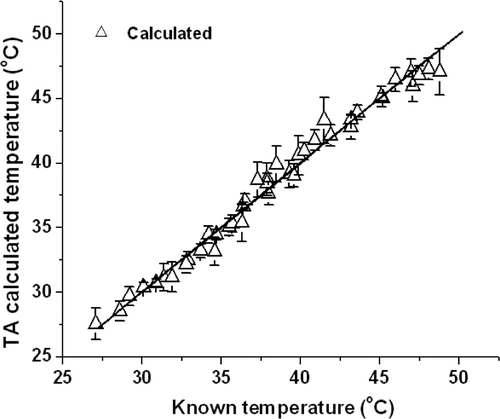
Figure 5. The calculated values (triangle) from thermoacoustic signals versus actual temperature recorded by a digital thermometer. The solid line represents the line of unity.

Figure 6. Pulsed microwave-induced acoustic pressure versus heating time with a pulse repetition frequency of 35 Hz. The inset image shows a sample made of agar and Fe3O4 particles.
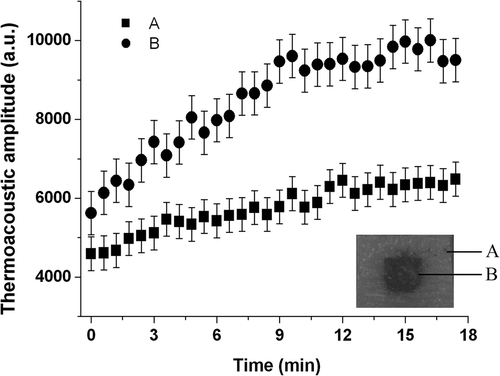
Figure 6. Pulsed microwave-induced acoustic pressure versus heating time with a pulse repetition frequency of 35 Hz. The inset image shows a sample made of agar and Fe3O4 particles.
Reprints and Corporate Permissions

Please note: Selecting permissions does not provide access to the full text of the article, please see our help page How do I view content?

To request a reprint or corporate permissions for this article, please click on the relevant link below:

Academic Permissions

Please note: Selecting permissions does not provide access to the full text of the article, please see our help page How do I view content?

Obtain permissions instantly via Rightslink by clicking on the button below:

If you are unable to obtain permissions via Rightslink, please complete and submit this Permissions form. For more information, please visit our Permissions help page.