644
Views
30
CrossRef citations to date
0
Altmetric
REVIEW ARTICLE

Present and future technology for simultaneous superficial thermoradiotherapy of breast cancer

, PhD, , , &
Pages 699-709 | Received 05 Mar 2010, Accepted 13 May 2010, Published online: 17 Sep 2010

Figures & data

Figure 1. Three-dimensional model of the SURLAS applicator showing basic components.

Figure 1. Three-dimensional model of the SURLAS applicator showing basic components.

Figure 2. Force balance results for the low (A) and high (B) frequency arrays. The three curves in each plot are for measurements for three different positions of the reflector with respect to an array. Distal was when the reflector was the furthest from the array in question and thus the ultrasound travelled the longest before reaching the force balance detector. Each data value was the average of five measurements. Standard deviations were too small to plot as error bars.
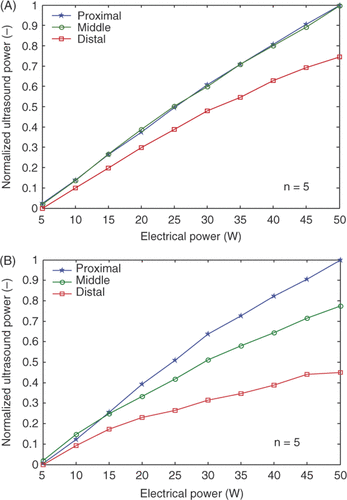
Figure 2. Force balance results for the low (A) and high (B) frequency arrays. The three curves in each plot are for measurements for three different positions of the reflector with respect to an array. Distal was when the reflector was the furthest from the array in question and thus the ultrasound travelled the longest before reaching the force balance detector. Each data value was the average of five measurements. Standard deviations were too small to plot as error bars.

Table I.  Maximum fundamental frequency (fmax) for four treatment window lengths (WL) and three array heights (AH).

Figure 3. Twelve-beam IMRT plan dose distributions on the axial, sagittal and coronal planes through the PTV and SURLAS applicator. An MVCT of the RANDO phantom with the SURLAS on top simulating a typical clinical set-up for the treatment of chest wall recurrence of breast cancer was used as the planning CT.

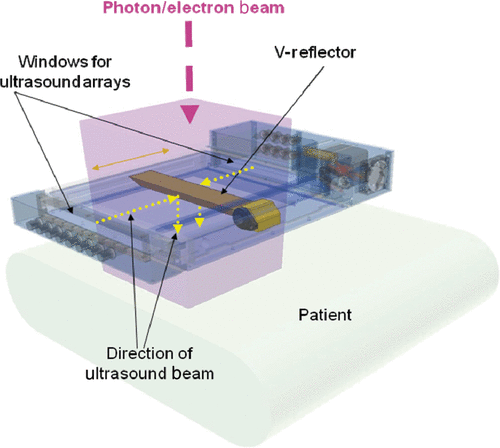
Figure 3. Twelve-beam IMRT plan dose distributions on the axial, sagittal and coronal planes through the PTV and SURLAS applicator. An MVCT of the RANDO phantom with the SURLAS on top simulating a typical clinical set-up for the treatment of chest wall recurrence of breast cancer was used as the planning CT.
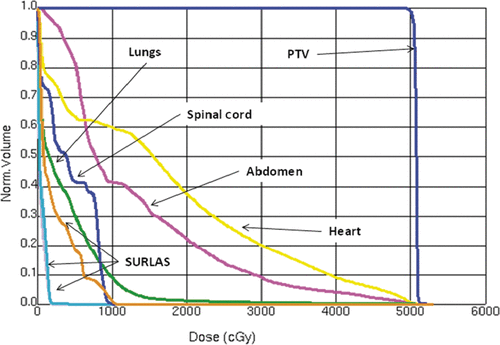
Figure 4. Dose volume histograms for the PTV and organs at risk for the treatment plan shown in .

Figure 4. Dose volume histograms for the PTV and organs at risk for the treatment plan shown in Figure 3.

Reprints and Corporate Permissions

Please note: Selecting permissions does not provide access to the full text of the article, please see our help page How do I view content?

To request a reprint or corporate permissions for this article, please click on the relevant link below:

Academic Permissions

Please note: Selecting permissions does not provide access to the full text of the article, please see our help page How do I view content?

Obtain permissions instantly via Rightslink by clicking on the button below:

If you are unable to obtain permissions via Rightslink, please complete and submit this Permissions form. For more information, please visit our Permissions help page.