Figures & data
Figure 1. Microwave ablation under ultrasound guidance: the linear hyperecho (white arrow) showed the tip of the thermal needle was under the liver capsule (red arrow) and the right linear hyperecho (green arrow) was the microwave needle.
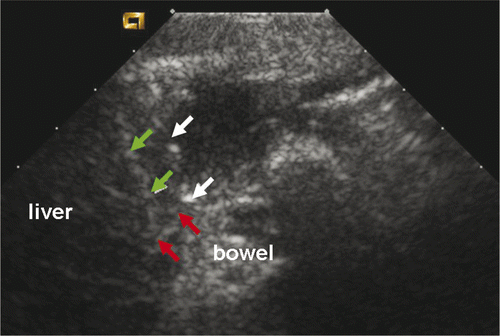
Figure 2. The curve showed the temperature was controlled between 55–65°C for 6 min in group C.
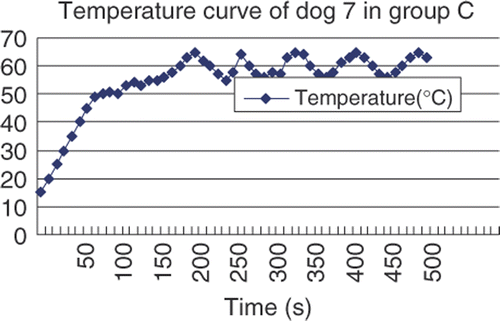
Figure 3. (A) Immediately after microwave ablation, contrast-enhanced CT showed the ablated lesions were located at the liver margin and were not enhanced (red arrow). The adjacent bowel walls were normal (green arrow). (B) Twenty-eight days after microwave ablation, the contrast-enhanced CT revealed there was no enhancement inside the lesion (red arrow) and the omentum covering the ablated liver was enhanced (green arrow).
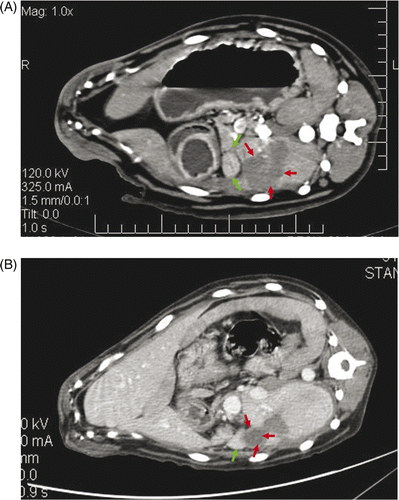
Table I. Results of twelve ablations.
Figure 4. (A) The bowel was severely damaged in group A within one hour of microwave ablation. The damaged bowel wall (yellow arrow), the ablation liver (red arrow). (B) Histological examination showed tissue congestion (red arrow) and oedema (black arrow) in submucosa and mucosa in large bowel in group A within one hour of microwave ablation (HE × 200).
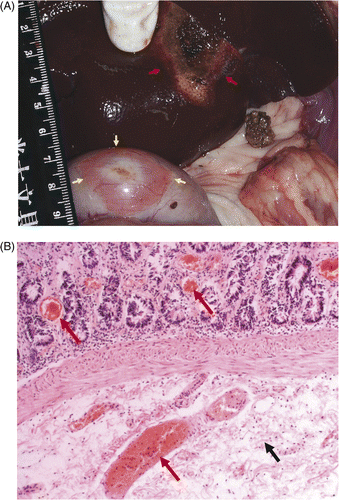
Figure 5. (A) Gross examination showed the colour of the pancreas (black arrow) abutting the ablated liver (white arrow) turned red in group B within one hour of microwave ablation. (B) Histological examination showed pancreatic cell degeneration (black arrow) and vessel haemorrhage (white arrow) in group B within one hour of microwave ablation (HE × 200).
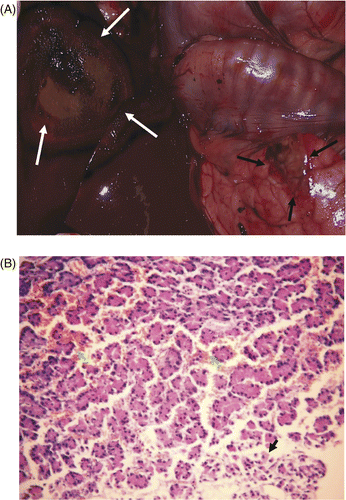
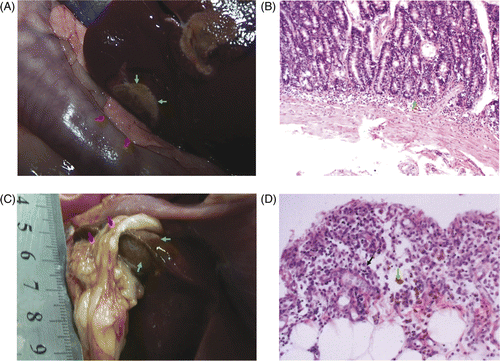
Figure 6. (A) Gross examination showed the colour of the bowel walls and pancreas (red) abutting the ablated liver (green arrow) were not changed obviously in group C within one hour of microwave ablation. (B) Histological examinations showed inflammatory cell infiltration (green arrow) in mucosa of small intestine wall (HE × 200). (C) On day 28 after microwave ablation, the surface of the ablated liver (green arrow) was brown and the edges were covered with omenta (red arrow). (D) On day 28 after microwave ablation, histological examination showed inflammatory reaction in omentum, including inflammatory cells (black arrow), and macrophages containing haemosiderin (green arrow) (HE × 200).