533
Views
5
CrossRef citations to date
0
Altmetric
Research Article

Non-invasive, quantitative monitoring of hyperthermia-induced EGFR activation in xenograft tumours

, , &
Pages 427-434 | Received 16 Jul 2010, Accepted 22 Feb 2011, Published online: 14 Jul 2011

Figures & data

Figure 1. Heat-induced EGFR activation in vitro. (A) Diagram of our EGFR-bioluminescent imaging reporter: EGFR and Shc proteins are fused to the N- and C-terminal fragments of luciferase. Upon activation of the EGFR pathway, e.g. by ligand binding, homo-dimers containing EGFR are formed and Shc is recruited to the complex, resulting in Shc phosphorylation and downstream signalling. Binding of EGFR-N-Luc to Shc-CLuc brings the two fragments in close proximity to each other, thus reconstituting luciferase activity. In the presence of the substrate luciferin, light is emitted which can be detected using a highly sensitive camera. (B) Induction of reporter activities in MDA-MB-231-EGFR-Shc-Luc cells. Left panel: cells were exposed to 43°C in a water bath for 30 min and imaged using an IVIS 200 imager at 3 h and 24 h after heating. Shown are luciferase signals of representative wells. Middle panel: graph of luciferase signals expressed as photon counts/s. Shown are average signal values of three individual wells, error bars represent standard error of the mean. Right panel: western blot analysis of total EGFR, mitogen-activated phosphokinase (MAPK), Shc levels the phosphorylated fraction of EGFR and MAPK in heated MDA-MB231 cells at 3 h and 24 h after heat treatment. Beta actin levels are shown as loading control.
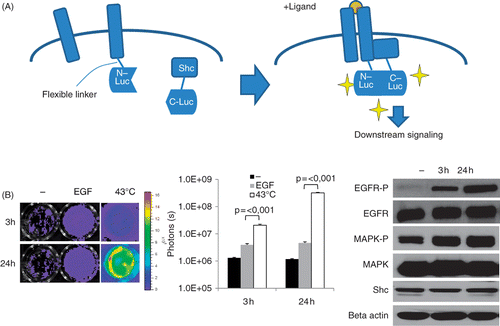
Figure 1. Heat-induced EGFR activation in vitro. (A) Diagram of our EGFR-bioluminescent imaging reporter: EGFR and Shc proteins are fused to the N- and C-terminal fragments of luciferase. Upon activation of the EGFR pathway, e.g. by ligand binding, homo-dimers containing EGFR are formed and Shc is recruited to the complex, resulting in Shc phosphorylation and downstream signalling. Binding of EGFR-N-Luc to Shc-CLuc brings the two fragments in close proximity to each other, thus reconstituting luciferase activity. In the presence of the substrate luciferin, light is emitted which can be detected using a highly sensitive camera. (B) Induction of reporter activities in MDA-MB-231-EGFR-Shc-Luc cells. Left panel: cells were exposed to 43°C in a water bath for 30 min and imaged using an IVIS 200 imager at 3 h and 24 h after heating. Shown are luciferase signals of representative wells. Middle panel: graph of luciferase signals expressed as photon counts/s. Shown are average signal values of three individual wells, error bars represent standard error of the mean. Right panel: western blot analysis of total EGFR, mitogen-activated phosphokinase (MAPK), Shc levels the phosphorylated fraction of EGFR and MAPK in heated MDA-MB231 cells at 3 h and 24 h after heat treatment. Beta actin levels are shown as loading control.

Figure 2. Further characterization of heat-induced EGFR activation in vitro. (A) Temperature dependence of heat-induced EGFR induction. Left panel shows quantitative analysis of luciferase signals of three different cell lines 24 h after heat treatment in a water bath at 42°, 43° and 44°C, respectively. Left panel shows the time course of EGFR induction by heat. Data are derived from three different cell lines equipped with the EGFR reporter after hyperthermia of 43°C for 30 min over a time period of 9 days. (B) Inhibition of heat-induced EGFR activation by EGFR inhibitors: MDA-MB-231 cells were incubated for 1 h with EGF and/or EGFR inhibitors as indicated, subjected to hyperthermia and imaged using a Xenogen IVIS imager. Shown is a quantitative analysis with corresponding bioluminescent images of representative wells. Error bars represent standard error of the mean of three individual wells. Cet, cetuximab; Gef, gefitinib. Right panel: western blot analysis of EGFR and MAPK and their phosphorylated versions 24 h after heat treatment of MDA-MB-231 cells with or without the presence of the EGFR inhibitor gefitinib (1 uM).
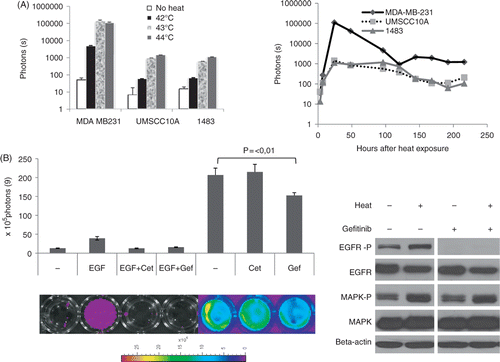
Figure 2. Further characterization of heat-induced EGFR activation in vitro. (A) Temperature dependence of heat-induced EGFR induction. Left panel shows quantitative analysis of luciferase signals of three different cell lines 24 h after heat treatment in a water bath at 42°, 43° and 44°C, respectively. Left panel shows the time course of EGFR induction by heat. Data are derived from three different cell lines equipped with the EGFR reporter after hyperthermia of 43°C for 30 min over a time period of 9 days. (B) Inhibition of heat-induced EGFR activation by EGFR inhibitors: MDA-MB-231 cells were incubated for 1 h with EGF and/or EGFR inhibitors as indicated, subjected to hyperthermia and imaged using a Xenogen IVIS imager. Shown is a quantitative analysis with corresponding bioluminescent images of representative wells. Error bars represent standard error of the mean of three individual wells. Cet, cetuximab; Gef, gefitinib. Right panel: western blot analysis of EGFR and MAPK and their phosphorylated versions 24 h after heat treatment of MDA-MB-231 cells with or without the presence of the EGFR inhibitor gefitinib (1 uM).

Figure 3. Key role of HSP90 in mediating heat induced EGFR activation. (A) Effect of geldanamycin on EGFR induction. Geldanamycin was preincubated 1 h prior to heating cells at 43°C for 30 min. Shown are bioluminescent images of representative wells acquired 7 h after heating using a Xenogen IVIS imager (left) and the quantitative analysis of the same experiment (right). GA, geldanamycin. (B) Knockdown of Hsp90. Cells were transfected with SMARTpool oligos (Fisher Scientific) directed against HSP90AA1, AB1 or non-targeting (scramble). After 2 days, cells were heated at 43°C for 30 min and imaged 6 h after heating. Left: western blot analysis of total Hsp90 protein levels after transfection with Hsp90 oligos as indicated. Middle: bioluminescent image of representative wells. Right: quantitative analysis of the same experiment. (C) Geldanamycin sensitizes cells to hyperthermia treatment. Left: representative bright field images of MDA-MB-231 cells 72 h after heat and/or geldanamycin (0.5 µM) treatment as indicated. Size bar = 200 µm. Middle: growth curve of MDA-MB-231 cells after heat and/or geldanamycin (0.5 µM) treatment. For each time-point, cells of three different wells of each treatment group were counted using a cell counting chamber. GA, geldanamycin. Right: clonogenic assay: After treatment with hyperthermia for 30 min in the presence or absence of geldanamycin, 200 cells of each treatment group were seeded into 10-cm dishes. Colonies were counted after 10 days. Error bars indicate standard error of the mean of three individual experiments.
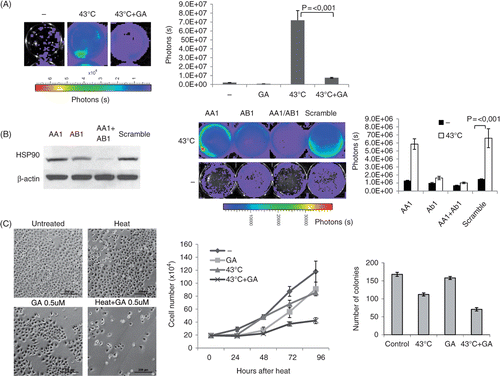
Figure 3. Key role of HSP90 in mediating heat induced EGFR activation. (A) Effect of geldanamycin on EGFR induction. Geldanamycin was preincubated 1 h prior to heating cells at 43°C for 30 min. Shown are bioluminescent images of representative wells acquired 7 h after heating using a Xenogen IVIS imager (left) and the quantitative analysis of the same experiment (right). GA, geldanamycin. (B) Knockdown of Hsp90. Cells were transfected with SMARTpool oligos (Fisher Scientific) directed against HSP90AA1, AB1 or non-targeting (scramble). After 2 days, cells were heated at 43°C for 30 min and imaged 6 h after heating. Left: western blot analysis of total Hsp90 protein levels after transfection with Hsp90 oligos as indicated. Middle: bioluminescent image of representative wells. Right: quantitative analysis of the same experiment. (C) Geldanamycin sensitizes cells to hyperthermia treatment. Left: representative bright field images of MDA-MB-231 cells 72 h after heat and/or geldanamycin (0.5 µM) treatment as indicated. Size bar = 200 µm. Middle: growth curve of MDA-MB-231 cells after heat and/or geldanamycin (0.5 µM) treatment. For each time-point, cells of three different wells of each treatment group were counted using a cell counting chamber. GA, geldanamycin. Right: clonogenic assay: After treatment with hyperthermia for 30 min in the presence or absence of geldanamycin, 200 cells of each treatment group were seeded into 10-cm dishes. Colonies were counted after 10 days. Error bars indicate standard error of the mean of three individual experiments.

Figure 4. Activation or EGFR after hyperthermia in vivo. Xenograft tumours were established by injecting 5 × 105 MDA-MB-231 EGFR/Shc-Luc cells into both hind legs of athymic nude mice. When tumours reached a diameter of about 7 mm, mice (n = 5) were placed in a custom-made restraining device with the right hind leg dipping into a 37°C water bath for 30 min. After treatment, mice were imaged over a time period of 4 days. Left: representative bioluminescent pseudocoloured image superimposed over a regular photograph. Right: quantitative analysis of the same experiment. Error bars indicate standard error of the mean.
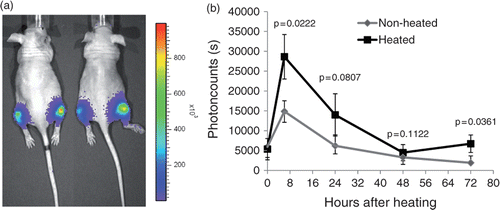
Figure 4. Activation or EGFR after hyperthermia in vivo. Xenograft tumours were established by injecting 5 × 105 MDA-MB-231 EGFR/Shc-Luc cells into both hind legs of athymic nude mice. When tumours reached a diameter of about 7 mm, mice (n = 5) were placed in a custom-made restraining device with the right hind leg dipping into a 37°C water bath for 30 min. After treatment, mice were imaged over a time period of 4 days. Left: representative bioluminescent pseudocoloured image superimposed over a regular photograph. Right: quantitative analysis of the same experiment. Error bars indicate standard error of the mean.

Reprints and Corporate Permissions

Please note: Selecting permissions does not provide access to the full text of the article, please see our help page How do I view content?

To request a reprint or corporate permissions for this article, please click on the relevant link below:

Academic Permissions

Please note: Selecting permissions does not provide access to the full text of the article, please see our help page How do I view content?

Obtain permissions instantly via Rightslink by clicking on the button below:

If you are unable to obtain permissions via Rightslink, please complete and submit this Permissions form. For more information, please visit our Permissions help page.