1,138
Views
12
CrossRef citations to date
0
Altmetric
Research Article

Effects of magnetic induction hyperthermia and radiotherapy alone or combined on a murine 4T1 metastatic breast cancer model

, , , , , & , PhD show all
Pages 563-572 | Received 31 Dec 2010, Accepted 20 Apr 2011, Published online: 16 Aug 2011

Figures & data

Figure 1. Tumour volume, lung metastasis and mouse survival after treatments. (A) Tumour volumes on the day of treatment (day 0) and 28 days after the treatment were shown as mean ± standard deviation in histograms. (B) Clonogenic lung metastasis assays were performed 25 days after the treatment. Each symbol represents a single animal (n = 9 per treatment group). (C) Mouse overall survival was defined as time to death or sacrifice. Kaplan-Meier curve was plotted to evaluate mouse survival among treatment groups: C, tumour-bearing control; R, radiotherapy; MIH, magnetic induction hyperthermia; MIH + R, magnetic induction hyperthermia plus radiotherapy. *P < 0.05 compared with group C; #P < 0.05 compared with group MIH + R.
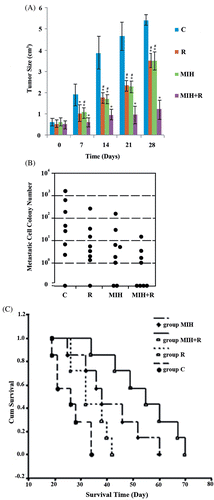
Figure 1. Tumour volume, lung metastasis and mouse survival after treatments. (A) Tumour volumes on the day of treatment (day 0) and 28 days after the treatment were shown as mean ± standard deviation in histograms. (B) Clonogenic lung metastasis assays were performed 25 days after the treatment. Each symbol represents a single animal (n = 9 per treatment group). (C) Mouse overall survival was defined as time to death or sacrifice. Kaplan-Meier curve was plotted to evaluate mouse survival among treatment groups: C, tumour-bearing control; R, radiotherapy; MIH, magnetic induction hyperthermia; MIH + R, magnetic induction hyperthermia plus radiotherapy. *P < 0.05 compared with group C; #P < 0.05 compared with group MIH + R.
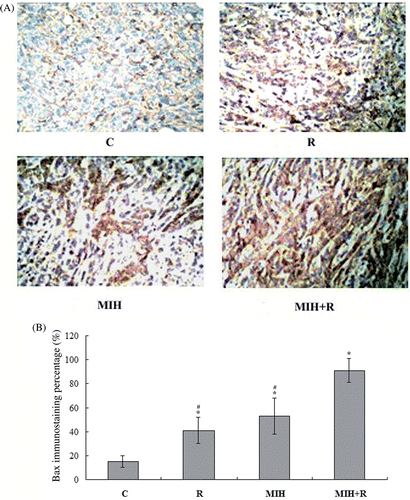
Figure 2. Immunohistochemical detection of Bax expression in the primary tumour. (A) Immunohistochemical analyses were performed to determine Bax expression in the primary tumour at the 4T1 cell injection site 25 days after the treatments. Positive staining for Bax was brownish in colour. Magnification, ×200. (B) Bax positive cells were counted and a percentage was calculated as follows: Bax positive cells/total tumour cells × 100%. The Bax immunostaining percentage in the tumour was compared among treatment groups: C, tumour-bearing control; R, radiotherapy; MIH, magnetic induction hyperthermia; MIH + R, magnetic induction hyperthermia plus radiotherapy. *P < 0.05 compared with group C; #P < 0.05 compared with group MIH + R.
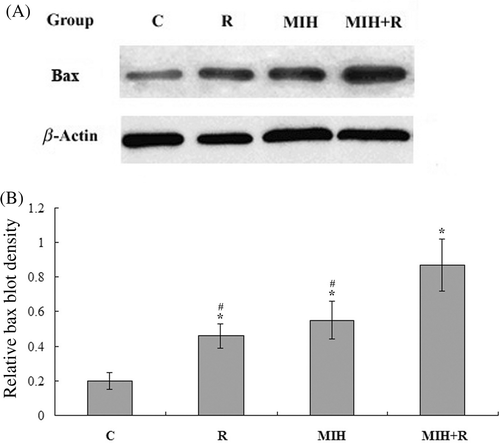
Figure 2. Immunohistochemical detection of Bax expression in the primary tumour. (A) Immunohistochemical analyses were performed to determine Bax expression in the primary tumour at the 4T1 cell injection site 25 days after the treatments. Positive staining for Bax was brownish in colour. Magnification, ×200. (B) Bax positive cells were counted and a percentage was calculated as follows: Bax positive cells/total tumour cells × 100%. The Bax immunostaining percentage in the tumour was compared among treatment groups: C, tumour-bearing control; R, radiotherapy; MIH, magnetic induction hyperthermia; MIH + R, magnetic induction hyperthermia plus radiotherapy. *P < 0.05 compared with group C; #P < 0.05 compared with group MIH + R.
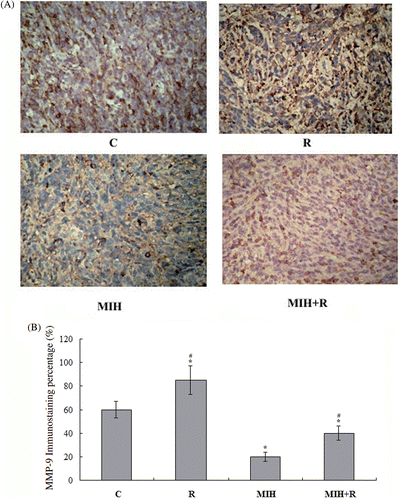
Figure 3. Western blot analysis of Bax expression in the primary tumour. (A) 25 days after the treatments, primary tumour tissue lysates from nine mice in each treatment group were subject to western blot analysis for Bax expression. β-actin blotting was used as a loading control. Representative results are shown in this figure. (B) Bax and β-actin blots were measured by densitometry. The density of the Bax blot was normalised against that of β-actin to obtain a relative Bax blot density. Treatment groups: C, tumour-bearing control; R, radiotherapy; MIH, magnetic induction hyperthermia; MIH + R, magnetic induction hyperthermia plus radiotherapy. *P < 0.05 compared with group C; #P < 0.05 compared with group MIH + R.
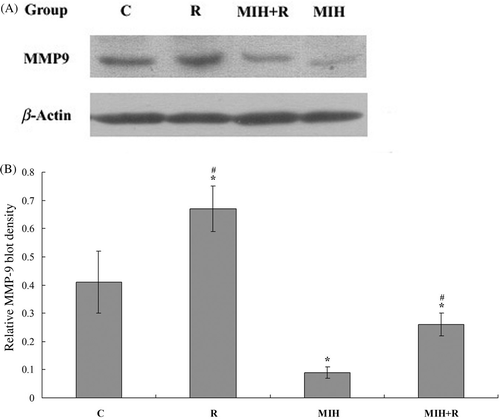
Figure 3. Western blot analysis of Bax expression in the primary tumour. (A) 25 days after the treatments, primary tumour tissue lysates from nine mice in each treatment group were subject to western blot analysis for Bax expression. β-actin blotting was used as a loading control. Representative results are shown in this figure. (B) Bax and β-actin blots were measured by densitometry. The density of the Bax blot was normalised against that of β-actin to obtain a relative Bax blot density. Treatment groups: C, tumour-bearing control; R, radiotherapy; MIH, magnetic induction hyperthermia; MIH + R, magnetic induction hyperthermia plus radiotherapy. *P < 0.05 compared with group C; #P < 0.05 compared with group MIH + R.

Figure 4. Immunohistochemical detection of MMP-9 expression in the primary tumour. (A) Immunohistochemical analyses were performed to determine MMP-9 expression in the primary tumour at the 4T1 cell injection site 25 days after the treatments. Positive staining for MMP-9 was brownish in colour. Magnification, ×200. (B) MMP-9 positive cells were counted and a percentage was calculated as follows: MMP9 positive cells/total tumour cells × 100%. The MMP-9 immunostaining percentage in the tumour was compared among treatment groups: C, tumour-bearing control; R, radiotherapy; MIH, magnetic induction hyperthermia; MIH + R, magnetic induction hyperthermia plus radiotherapy. *P < 0.05 compared with group C; #P < 0.05 compared with group MIH + R.

Figure 4. Immunohistochemical detection of MMP-9 expression in the primary tumour. (A) Immunohistochemical analyses were performed to determine MMP-9 expression in the primary tumour at the 4T1 cell injection site 25 days after the treatments. Positive staining for MMP-9 was brownish in colour. Magnification, ×200. (B) MMP-9 positive cells were counted and a percentage was calculated as follows: MMP9 positive cells/total tumour cells × 100%. The MMP-9 immunostaining percentage in the tumour was compared among treatment groups: C, tumour-bearing control; R, radiotherapy; MIH, magnetic induction hyperthermia; MIH + R, magnetic induction hyperthermia plus radiotherapy. *P < 0.05 compared with group C; #P < 0.05 compared with group MIH + R.

Figure 5. Western blot analysis of MMP-9 expression in the primary tumour. (A) 25 days after the treatments, primary tumour tissue lysates from nine mice in each treatment group were subject to western blot analysis for MMP-9 expression. β-actin blotting was used as a loading control. Representative results are shown in this figure. (B) MMP-9 and β-actin blots were measured by densitometry. The density of the MMP-9 blot was normalised against that of β-actin to obtain a relative MMP-9 blot density. Treatment groups: C, tumour-bearing control; R, radiotherapy; MIH, magnetic induction hyperthermia; MIH + R, magnetic induction hyperthermia plus radiotherapy. *P < 0.05 compared with group C; #P < 0.05 compared with group MIH + R.

Figure 5. Western blot analysis of MMP-9 expression in the primary tumour. (A) 25 days after the treatments, primary tumour tissue lysates from nine mice in each treatment group were subject to western blot analysis for MMP-9 expression. β-actin blotting was used as a loading control. Representative results are shown in this figure. (B) MMP-9 and β-actin blots were measured by densitometry. The density of the MMP-9 blot was normalised against that of β-actin to obtain a relative MMP-9 blot density. Treatment groups: C, tumour-bearing control; R, radiotherapy; MIH, magnetic induction hyperthermia; MIH + R, magnetic induction hyperthermia plus radiotherapy. *P < 0.05 compared with group C; #P < 0.05 compared with group MIH + R.

Table 1A.  T cell subset change in peripheral blood 25 days after treatment (n = 5).

Table 1B.  Serum cytokine level change 25 days after treatment (n = 5).

Supplemental material

Supplemental references.

Download PDF (169.7 KB)

Reprints and Corporate Permissions

Please note: Selecting permissions does not provide access to the full text of the article, please see our help page How do I view content?

To request a reprint or corporate permissions for this article, please click on the relevant link below:

Academic Permissions

Please note: Selecting permissions does not provide access to the full text of the article, please see our help page How do I view content?

Obtain permissions instantly via Rightslink by clicking on the button below:

If you are unable to obtain permissions via Rightslink, please complete and submit this Permissions form. For more information, please visit our Permissions help page.