556
Views
12
CrossRef citations to date
0
Altmetric
Research Article

Infrared heat treatment reduces food intake and modifies expressions of TRPV3-POMC in the dorsal medulla of obesity prone rats

, & , MD, PhD
Pages 708-716 | Received 05 May 2011, Accepted 24 Jun 2011, Published online: 03 Oct 2011

Figures & data

Figure 1. Photograph illustrating the experimental set-up used in infrared heat application. The infrared heating device, TDP CQ-27 (Lhasa OMS, Weymouth, MA), was utilised as a heat source. The infrared heat lamp is placed above an open-filtered mouse cage, and temperature is maintained by adjusting the proximity of the lamp to the chamber. Temperature is monitored and kept between 36–40°C by a digital temperature controller (Harvard Bioscience, Holliston, MA), with the sensor placed inside the heating chamber, as labelled.
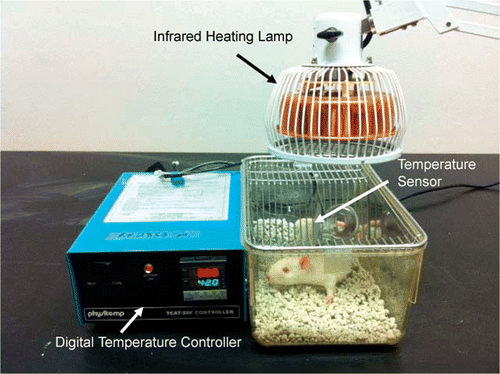
Figure 1. Photograph illustrating the experimental set-up used in infrared heat application. The infrared heating device, TDP CQ-27 (Lhasa OMS, Weymouth, MA), was utilised as a heat source. The infrared heat lamp is placed above an open-filtered mouse cage, and temperature is maintained by adjusting the proximity of the lamp to the chamber. Temperature is monitored and kept between 36–40°C by a digital temperature controller (Harvard Bioscience, Holliston, MA), with the sensor placed inside the heating chamber, as labelled.

Figure 2. Bar graph representing food intake of all rats across 8 days of experimentation. Infrared heat treatment started on day 3. OR rats showed significantly lowered food intake compared to OP controls throughout the experiment. OP heated rats showed significantly reduced food intake after 4 days of daily heat treatment. Each bar represents the mean values and vertical lines represent SEM (n = 5–7). *P < 0.05 (analysis of variance) compared with OR control; #P < 0.05 compared with OP control.
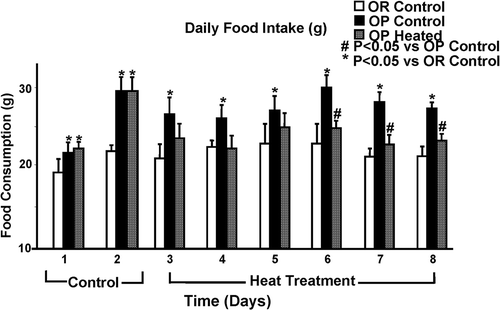
Figure 2. Bar graph representing food intake of all rats across 8 days of experimentation. Infrared heat treatment started on day 3. OR rats showed significantly lowered food intake compared to OP controls throughout the experiment. OP heated rats showed significantly reduced food intake after 4 days of daily heat treatment. Each bar represents the mean values and vertical lines represent SEM (n = 5–7). *P < 0.05 (analysis of variance) compared with OR control; #P < 0.05 compared with OP control.

Table I. Mean arterial blood pressure and body weight of OP (Obese Prone) control rats compared to age matched OP heated and OR (Obese Resistant) control rats. Heating began on day 3 for OP Heated Rats.

Figure 3. These low (left) and high (right) magnification micrographs from medulla sections show the structures and distributions of TRPV3 staining in response to infrared heat treatment in an OR control rat (top), OP control (middle), and OP heated (bottom) rat. Full body infrared heat treatment resulted in a decrease of TRPV3 staining neurons (indicated by arrows) in the hypoglossal nucleus of the medulla (HgN) in an OP heated rat (bottom) compared to an OP control animal (middle).
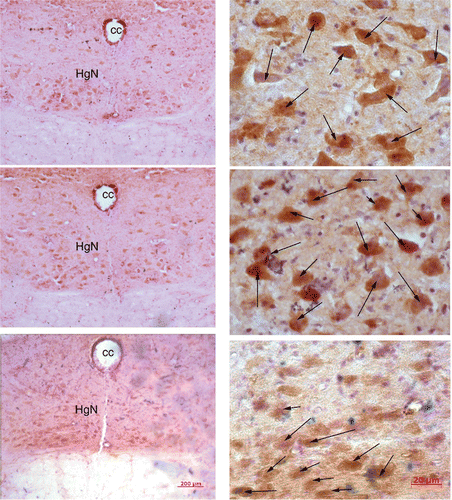
Figure 3. These low (left) and high (right) magnification micrographs from medulla sections show the structures and distributions of TRPV3 staining in response to infrared heat treatment in an OR control rat (top), OP control (middle), and OP heated (bottom) rat. Full body infrared heat treatment resulted in a decrease of TRPV3 staining neurons (indicated by arrows) in the hypoglossal nucleus of the medulla (HgN) in an OP heated rat (bottom) compared to an OP control animal (middle).

Figure 4. Quantitation of TRPV3 immunoreactivity in the hypoglossal nucleus and medial nucleus tractus solitarius (mNTS) in infrared heat-treated OP rats compared with OP control and OR control rats. TRPV3 immunostaining cells in the hypoglossal nucleus (left side) are significantly reduced in heat-treated OP rats and OR control rats, in comparison to OP control rats. In the mNTS (right side), OP heated and OR rats also displayed significantly lowered positive staining neuron counts, but the absolute difference was less. Each bar represents the mean values and the vertical lines represent SEM (n = 5–7). *P < 0.05 (analysis of variance), compared with OR control; #P < 0.05 compared with OP control.
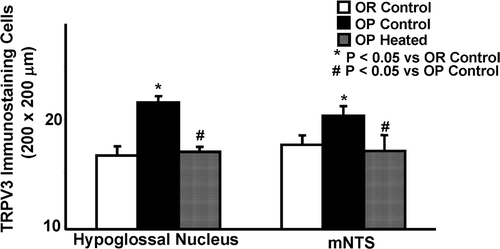
Figure 4. Quantitation of TRPV3 immunoreactivity in the hypoglossal nucleus and medial nucleus tractus solitarius (mNTS) in infrared heat-treated OP rats compared with OP control and OR control rats. TRPV3 immunostaining cells in the hypoglossal nucleus (left side) are significantly reduced in heat-treated OP rats and OR control rats, in comparison to OP control rats. In the mNTS (right side), OP heated and OR rats also displayed significantly lowered positive staining neuron counts, but the absolute difference was less. Each bar represents the mean values and the vertical lines represent SEM (n = 5–7). *P < 0.05 (analysis of variance), compared with OR control; #P < 0.05 compared with OP control.

Figure 5. Micrographs, low (left) and high (right) magnification, showing number of POMC positive staining neurons in the medial NTS (mNTS) of an OR control (top), OP control (middle), and OP heated rat (bottom). POMC staining cells (indicated by arrows) were increased in the mNTS in the heat-treated OP rat (bottom) and OR control rat (top) when compared to the OP control (middle).
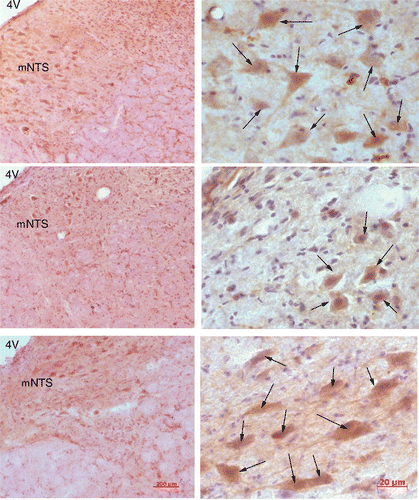
Figure 5. Micrographs, low (left) and high (right) magnification, showing number of POMC positive staining neurons in the medial NTS (mNTS) of an OR control (top), OP control (middle), and OP heated rat (bottom). POMC staining cells (indicated by arrows) were increased in the mNTS in the heat-treated OP rat (bottom) and OR control rat (top) when compared to the OP control (middle).

Figure 6. Quantitation of POMC immunoreactivity in the hypoglossal nucleus and medial nucleus tractus solitarius (mNTS) in infrared heat-treated OP rats compared with OP control and OR control rats. POMC immunostaining cells in the hypoglossal nucleus (left side) are increased in heat-treated OP rats and OR control rats, in comparison to OP control rats, but this change was short of statistical significance. In the mNTS (right side), OP heated and OR rats displayed significantly increased POMC positive staining neuron counts. Each bar represents the mean values and the vertical lines represent SEM (n = 5–7). *P < 0.05 (analysis of variance), compared with OR control; #P < 0.05 compared with OP control.
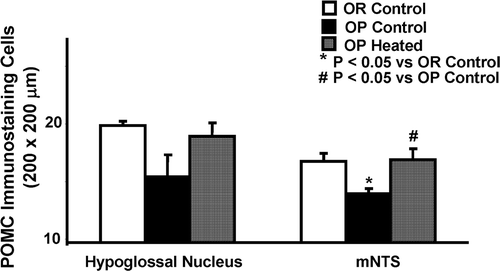
Figure 6. Quantitation of POMC immunoreactivity in the hypoglossal nucleus and medial nucleus tractus solitarius (mNTS) in infrared heat-treated OP rats compared with OP control and OR control rats. POMC immunostaining cells in the hypoglossal nucleus (left side) are increased in heat-treated OP rats and OR control rats, in comparison to OP control rats, but this change was short of statistical significance. In the mNTS (right side), OP heated and OR rats displayed significantly increased POMC positive staining neuron counts. Each bar represents the mean values and the vertical lines represent SEM (n = 5–7). *P < 0.05 (analysis of variance), compared with OR control; #P < 0.05 compared with OP control.

Reprints and Corporate Permissions

Please note: Selecting permissions does not provide access to the full text of the article, please see our help page How do I view content?

To request a reprint or corporate permissions for this article, please click on the relevant link below:

Academic Permissions

Please note: Selecting permissions does not provide access to the full text of the article, please see our help page How do I view content?

Obtain permissions instantly via Rightslink by clicking on the button below:

If you are unable to obtain permissions via Rightslink, please complete and submit this Permissions form. For more information, please visit our Permissions help page.