503
Views
3
CrossRef citations to date
0
Altmetric
Research Article

Non-invasive temperature measurement by using phase changes in electromagnetic waves in a cavity resonator

&
Pages 726-736 | Received 21 Feb 2011, Accepted 27 Jun 2011, Published online: 03 Oct 2011

Figures & data

Figure 1. Electromagnetic distribution of the lowest (TE101) mode in a rectangular cavity resonator.
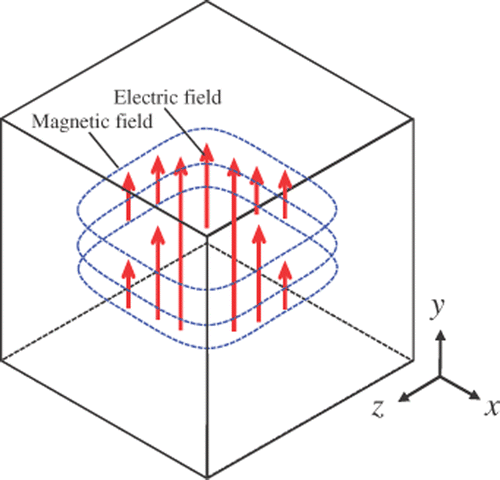
Figure 1. Electromagnetic distribution of the lowest (TE101) mode in a rectangular cavity resonator.

Figure 2. Cross section of applicator and electromagnetic field distribution of the lowest (TM010) mode in a re-entrant cavity resonator.

Figure 2. Cross section of applicator and electromagnetic field distribution of the lowest (TM010) mode in a re-entrant cavity resonator.

Figure 3. CT algorithm. Phase change distribution before and after a temperature change in a heating applicator (re-entrant cavity resonator) (A) is acquired as projection data at each rotational angle (B).
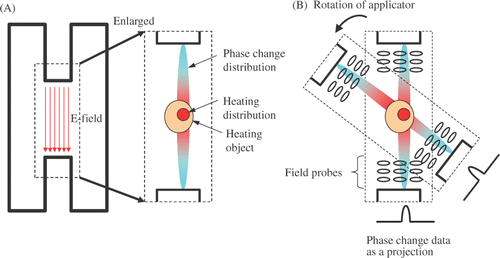
Figure 3. CT algorithm. Phase change distribution before and after a temperature change in a heating applicator (re-entrant cavity resonator) (A) is acquired as projection data at each rotational angle (B).

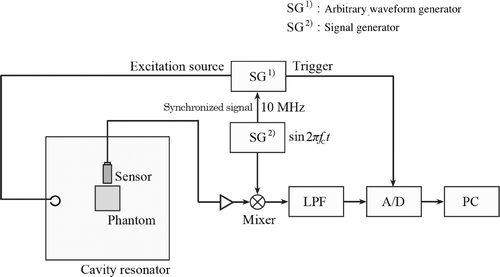
Figure 4. Configuration diagram of prototype temperature measurement system.

Figure 4. Configuration diagram of prototype temperature measurement system.

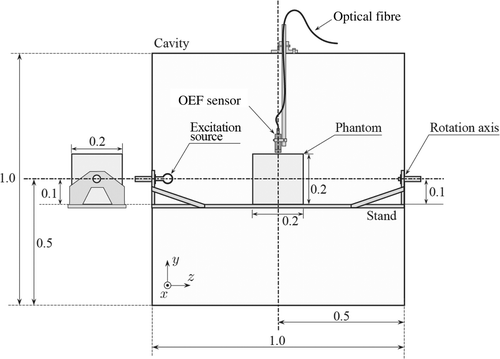
Figure 5. Overview of prototype system. Third angle projection of rectangular cavity resonator (A). External view of entire system (B).
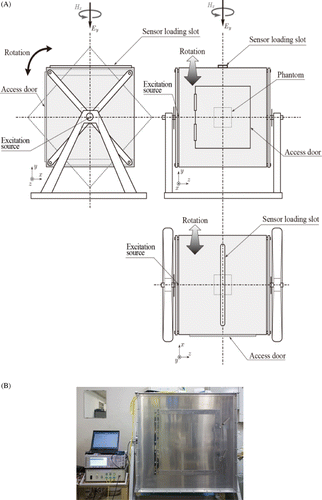
Figure 5. Overview of prototype system. Third angle projection of rectangular cavity resonator (A). External view of entire system (B).

Figure 6. Internal structure of rectangular cavity resonator.

Figure 6. Internal structure of rectangular cavity resonator.

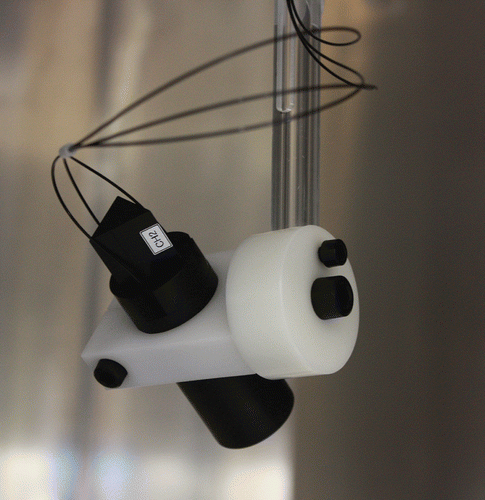
Figure 7. Optical electric sensor head held by a Teflon fixture.

Figure 7. Optical electric sensor head held by a Teflon fixture.

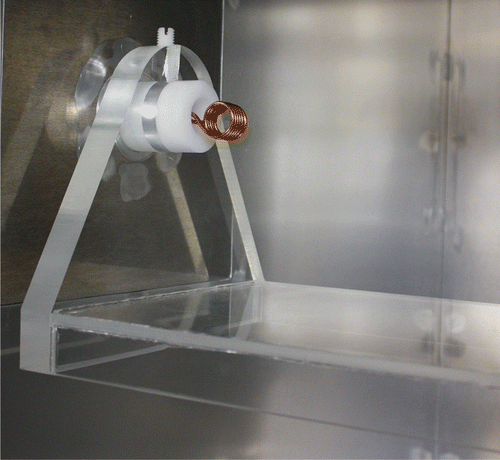
Figure 8. Fixed table made from acrylic to hold the phantom.

Figure 8. Fixed table made from acrylic to hold the phantom.

Figure 9. Excitation waveform for cavity resonator. Gaussian waveform modulated by resonant frequency (A). Frequency component of this time waveform (B).

Figure 9. Excitation waveform for cavity resonator. Gaussian waveform modulated by resonant frequency (A). Frequency component of this time waveform (B).

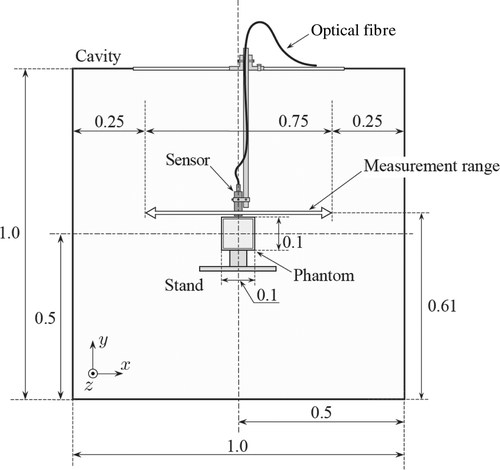
Figure 10. Set-up of phantom and collection range of projection data in cavity resonator.

Figure 10. Set-up of phantom and collection range of projection data in cavity resonator.

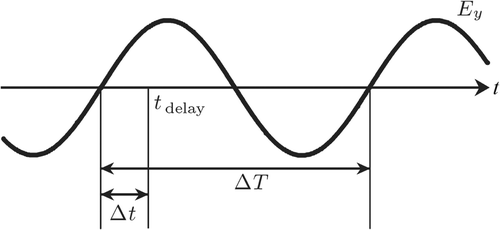
Figure 11. Definition for calculating the phase information at a given delay time.

Figure 11. Definition for calculating the phase information at a given delay time.

Figure 12. Waveform of electric field measured using optical electric field sensor at each position. The sensor was moved in the x (axial) direction near the centre of the cavity resonator, as shown in (x = 0.25–0.75 m). Time series waveform of y component of electric field for pure water (A). Time series waveform of y component of electric field for glycerine (B).
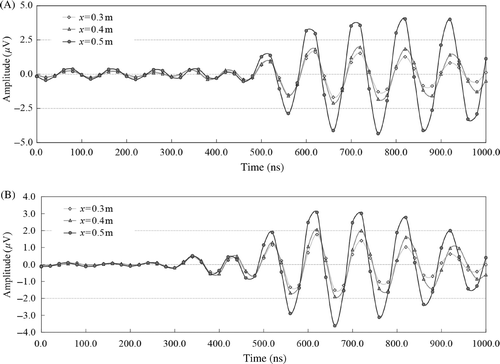
Figure 12. Waveform of electric field measured using optical electric field sensor at each position. The sensor was moved in the x (axial) direction near the centre of the cavity resonator, as shown in Figure 10 (x = 0.25–0.75 m). Time series waveform of y component of electric field for pure water (A). Time series waveform of y component of electric field for glycerine (B).

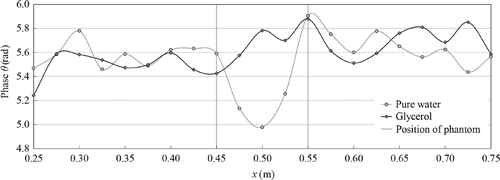
Figure 13. Phase distribution of electromagnetic waves for each phantom.

Figure 13. Phase distribution of electromagnetic waves for each phantom.

Figure 14. Phase difference with the dielectric constant change, which simulated a temperature change, as projection data.
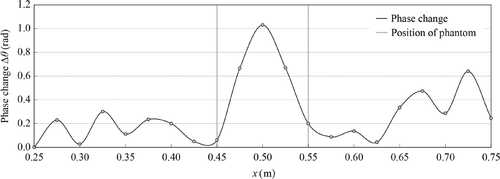
Figure 14. Phase difference with the dielectric constant change, which simulated a temperature change, as projection data.

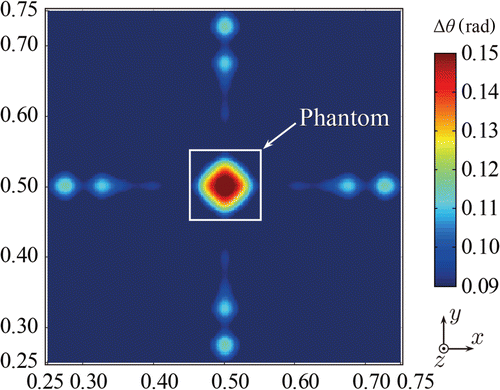
Figure 15. Phase change image reconstructed from 4-projection data by simple back projection.

Figure 15. Phase change image reconstructed from 4-projection data by simple back projection.

Figure 16. Numerical analysis results Citation[12] showing detection sensitivity of phase changes in a rectangular cavity resonator.

Figure 16. Numerical analysis results Citation[12] showing detection sensitivity of phase changes in a rectangular cavity resonator.

Reprints and Corporate Permissions

Please note: Selecting permissions does not provide access to the full text of the article, please see our help page How do I view content?

To request a reprint or corporate permissions for this article, please click on the relevant link below:

Academic Permissions

Please note: Selecting permissions does not provide access to the full text of the article, please see our help page How do I view content?

Obtain permissions instantly via Rightslink by clicking on the button below:

If you are unable to obtain permissions via Rightslink, please complete and submit this Permissions form. For more information, please visit our Permissions help page.