Figures & data
Figure 1. A schematic diagram showing the functionalisation steps from Si-MP-O to DOX-loaded Si-SS-CD-PEG. (A) The concept of GSH-induced release of DOX from the pores of Si-SS-CD-PEG. (B) The synthetic steps from Si-MP-O to the Si-SS-CD-PEG nanocontainer Citation[17]: (1) addition of 3-mercaptopropyltrimethoxysilane; (2) use of S-(2-aminoethylthio)-2-thiopyridine hydrochloride; (3) addition of propargyl bromide; (4) removal of CTAB; followed by DOX loading and treatment with CuSO4, sodium ascorbate, and mono-6-azido-β-CD; (5) Addition of NCO-PEG5000 and dibutyltin dilaurate.
![Figure 1. A schematic diagram showing the functionalisation steps from Si-MP-O to DOX-loaded Si-SS-CD-PEG. (A) The concept of GSH-induced release of DOX from the pores of Si-SS-CD-PEG. (B) The synthetic steps from Si-MP-O to the Si-SS-CD-PEG nanocontainer Citation[17]: (1) addition of 3-mercaptopropyltrimethoxysilane; (2) use of S-(2-aminoethylthio)-2-thiopyridine hydrochloride; (3) addition of propargyl bromide; (4) removal of CTAB; followed by DOX loading and treatment with CuSO4, sodium ascorbate, and mono-6-azido-β-CD; (5) Addition of NCO-PEG5000 and dibutyltin dilaurate.](/cms/asset/63aea719-1bd9-4e30-b749-744b6f9f3a11/ihyt_a_608217_f0001_b.gif)
Figure 2. Representative release profile of DOX from DOX-loaded Si-SS-CD-PEG in PBS containing 0 mM or 1 mM GSH at 37°C or 42°C. (1) Without GSH at 37°C; (2) without GSH at 42°C; (3) with 1 mM GSH at 37°C; (4) with 1 mM GSH at 42°C.
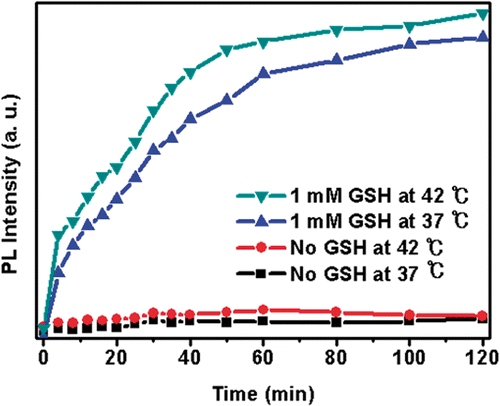
Figure 3. Effect of hyperthermia on intracellular release of DOX from DOX-loaded Si-SS-CD-PEG in A549 cells. (A) Representative fluorescence images of A549 cells incubated with DOX-loaded Si-SS-CD-PEG at 37°C or 42°C. Upper panel: cells were first heated at 42°C for 1 h with DOX-loaded Si-SS-CD-PEG, and then further incubated with DOX-loaded Si-SS-CD-PEG at 37°C for 7 h. Lower panel: cells were treated with DOX-loaded Si-SS-CD-PEG at 42°C for 1 h, washed and incubated at 37°C for 7 h. The amount of internalised DOX was detected by using a confocal microscopy. (B) The relative fluorescence intensities of DOX per cell were quantified. Data are expressed as means of three independent experiments ± 1 SE. (C) Relative levels of GSH in A549 cells at 37°C or 42°C. A549 cells were exposed to heat for 1 h, and then further incubated at 37°C for 3 to 9 h. Data are means of thee independent experiments ± 1 SE. *P < 0.05, **P < 0.01, ***P < 0.001. MTH, mild temperature hyperthermia.
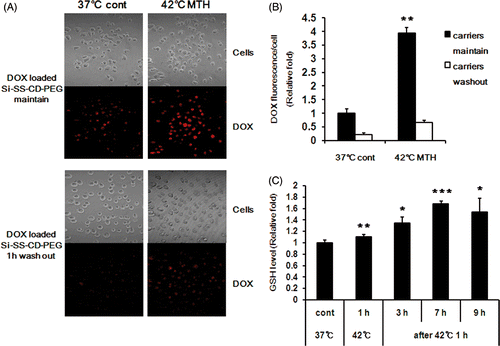
Figure 4. Effect of intracellular GSH concentration on DOX release in A549 and L-132 cells. (A) The relative levels of GSH in A549 and L-132 cells at 37°C and 42°C. The cells were heated at 42°C for 1 h, and then further incubated at 37°C for 7 h. Average values obtained from three independent experiments ± 1 SE are shown. (B) Representative fluorescence images of A549 and L-132 cells incubated with DOX-loaded Si-SS-CD-PEG at 37°C for 8 h or incubated with DOX-loaded Si-SS-CD-PEG at 42°C for 1 h and then incubated at 37°C for 7 h. The amount of internalised DOX was detected by using a confocal microscopy. (C) The relative fluorescence intensities of DOX per cell were quantified by pixel intensity using Image J software (NIH), and data was normalised to the cell number. Data are expressed as means of three independent experiments ± 1 SE. **P < 0.01.
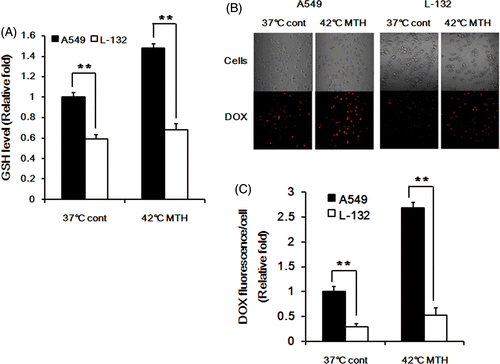
Figure 5. Effect of hyperthermia on intracellular release of DOX from DOX-loaded Si-SS-CD-PEG in RKO, HeLa and MIA PaCa-2 cells. (A) Representative fluorescence images of the cells incubated with DOX-loaded Si-SS-CD-PEG at 37°C for 8 h or heated at 42° for 1 h with DOX-loaded Si-SS-CD-PEG, and then further incubated with the carrier at 37°C for 7 h. The amount of internalised DOX was detected by using confocal microscopy. (B) The relative fluorescence intensities of DOX per cell were quantified. Data are expressed as means of three independent experiments ± 1 SE. (C) The relative levels of GSH in the cells at 37°C or that in the cells heated at 42°C for 1 h and then further incubated at 37°C for 7 h. Data are means of thee independent experiments ± 1 SE. *P < 0.05, **P < 0.01, ***P < 0.001.
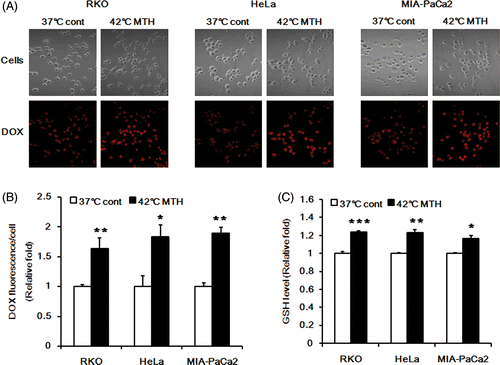
Figure 6. Effect of hyperthermia on the clonogenic survival of A549 cells treated with DOX-loaded Si-SS-CD-PEG. (A) A549 cells were heated at 42°C for 1 h with free Si-SS-CD-PEG or DOX-loaded Si-SS-CD-PEG and then further incubated with the carrier at 37°C for 23 h. After the incubation, cells were washed and cultured for a further 10–14 days, and survival proportions were calculated. (B) A549 and L-132 cells were heated at 42°C for 1 h with free DOX, washed, cultured for a further 10–14 days, and the surviving fractions were obtained from the number of colonies. Data are as means of three independent experiments ± 1 SE. *P < 0.05, **P < 0.01, ***P < 0.001.
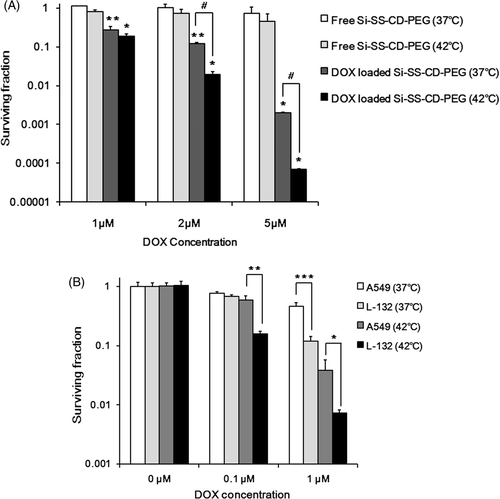
Figure 7. Effect of hyperthermia on the level of apoptosis caused by DOX-loaded Si-SS-CD-PEG and molecular signals involved in apoptosis (A) Representative photomicrographs of apoptotic cells, i.e. TUNEL-positive cells, after treatment with free Si-SS-CD-PEG or DOX-loaded Si-SS-CD-PEG at 37°C or 42°C. A549 cells were first heated at 42°C for 1 h with free Si-SS-CD-PEG or DOX- Si-SS-CD-PEG and then incubated with the carrier at 37°C for 23 h. TUNEL-positive cells were detected under a confocal microscopy. (B) Relative fluorescence intensities were quantified and normalised to the fluorescence intensity of DAPI. Data are expressed as means of three independent experiments ± 1 SE. (C) Effect of hyperthermia on the caspase activity in cells treated with DOX-loaded Si-SS-CD-PEG. Cells were heated at 42°C for 1 h with free Si-SS-CD-PEG or DOX-loaded Si-SS-CD-PEG, and then further incubated with the carrier at 37°C for 11 h. Protein levels were determined by western blotting. Representative examples from five repeat experiments are shown. *P < 0.05, **P < 0.01.
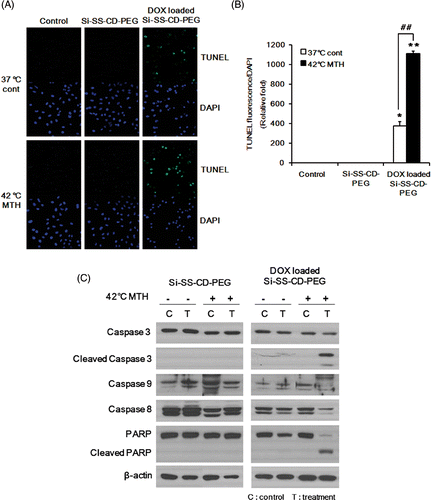
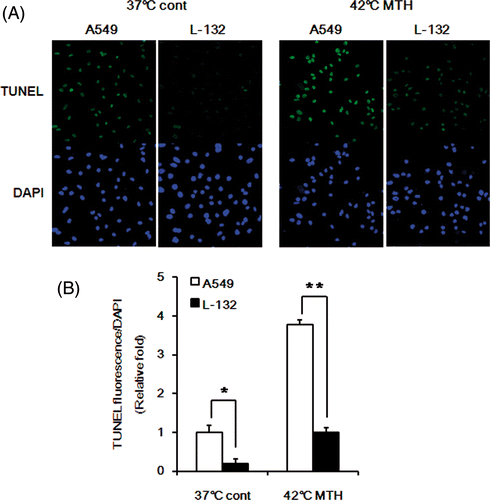
Figure 8. Comparison of apoptosis in A549 and L-132 cells. (A) Representative photomicrographs of apoptotic cells, i.e. TUNEL-positive in A549 and L-132 cells after treatment with DOX-loaded Si-SS-CD-PEG at 37°C or 42°C. Cells were first heated at 42°C for 1 h with DOX-loaded Si-SS-CD-PEG, and then further incubated with the carrier at 37°C for 23 h. TUNEL-positive cells were detected under confocal microscopy. (B) Relative fluorescence intensities were quantified by pixel intensity using Image J software (NIH), and data was normalised to the fluorescence intensity of DAPI. Data are expressed as means of three independent experiments ± 1 SE. *P < 0.05, **P < 0.01.
