846
Views
33
CrossRef citations to date
0
Altmetric
Research Article

CT-based temperature monitoring during hepatic RF ablation: Feasibility in an animal model

, MD, , , , , , , , , , & show all
Pages 55-61 | Received 09 Feb 2011, Accepted 29 Aug 2011, Published online: 11 Jan 2012

Figures & data

Figure 1. Schematic drawing of the experimental setup used for the ex vivo study. The scattered lines represent the axial CT images that were reconstructed. Distances between RF applicator and temperature probes were 5, 10 and 15 mm, respectively.
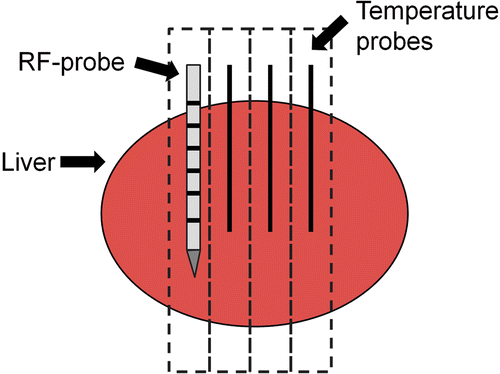
Figure 1. Schematic drawing of the experimental setup used for the ex vivo study. The scattered lines represent the axial CT images that were reconstructed. Distances between RF applicator and temperature probes were 5, 10 and 15 mm, respectively.

Figure 2. Examples for ex vivo (A) and in vivo (B) measurements of local temperature around the tip of a temperature probe during Radiofrequency ablation. Note the beam hardening artefacts in (B) caused by the RF-applicator.
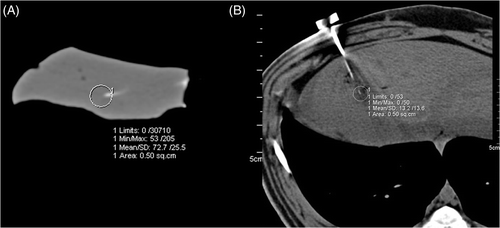
Figure 2. Examples for ex vivo (A) and in vivo (B) measurements of local temperature around the tip of a temperature probe during Radiofrequency ablation. Note the beam hardening artefacts in (B) caused by the RF-applicator.

Figure 3. Experimental setup used for the in vivo experiments with the animal lying in supine position. RF applicator (black arrow) and three temperature probes (white arrow) are inserted parallel.
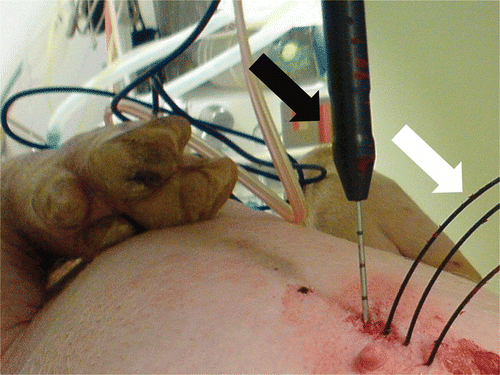
Figure 3. Experimental setup used for the in vivo experiments with the animal lying in supine position. RF applicator (black arrow) and three temperature probes (white arrow) are inserted parallel.

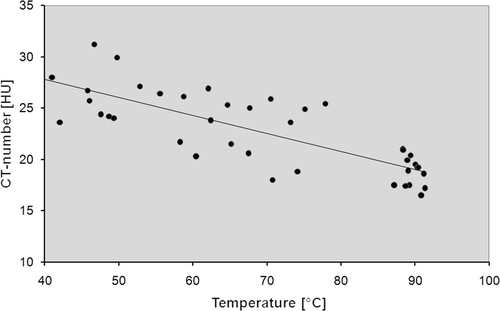
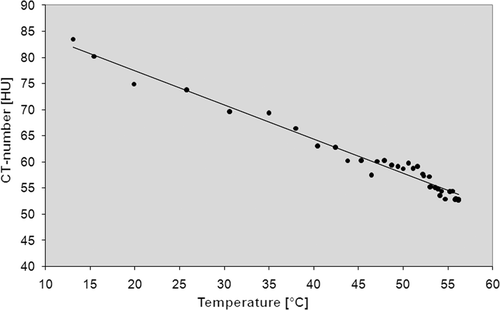
Figure 4. The scatter diagram for a single ex vivo experiment.

Figure 4. The scatter diagram for a single ex vivo experiment.

Table I.  Results of the ex vivo study. Temperature data and measured CT-numbers derived from the 10 experiments were pooled for each temperature probe position.

Figure 5. The scatter diagram for a single in vivo experiment.

Figure 5. The scatter diagram for a single in vivo experiment.

Table II.  Results of the in vivo study (pig 1).

Table III.  Results of the in vivo study (pig 2).

Table IV.  Results of the in vivo study (pig 3).

Table V.  Results of the in vivo study (pig 4).
Reprints and Corporate Permissions

Please note: Selecting permissions does not provide access to the full text of the article, please see our help page How do I view content?

To request a reprint or corporate permissions for this article, please click on the relevant link below:

Academic Permissions

Please note: Selecting permissions does not provide access to the full text of the article, please see our help page How do I view content?

Obtain permissions instantly via Rightslink by clicking on the button below:

If you are unable to obtain permissions via Rightslink, please complete and submit this Permissions form. For more information, please visit our Permissions help page.