Figures & data
Table I. Prostate tissue physiological parameters used during numerical modelling of transurethral ultrasound prostate treatment.
Table II. Canine prostate geometries and consequences on the transducer total length and number of active elements.
Table III. MRI acquisition parameters based on preclinical canine studies.
Figure 1. (a) The concept behind 3D MRI-controlled transurethral ultrasound therapy using a dual-frequency approach. During device rotation, the ultrasound frequency is switched between the fundamental frequency flow of the transducer and its 3rd harmonic fhigh ≈ 3flow. The crossover radius, Rco, determines the distance threshold for switching frequencies and was chosen to optimize treatment time and accuracy. If the prostate radius is lower than Rco, then f = fhigh, otherwise f = flow. (b) A photograph is shown of a multielement transurethral applicator consisting of 9 active elements, each measuring 5 mm long.
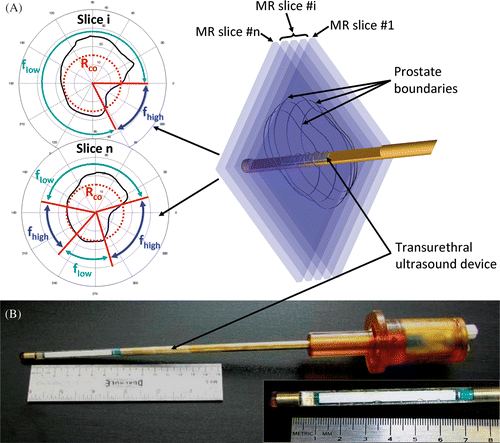
Table IV. Prostate geometries studied during in vitro ultrasound treatments.
Figure 2. Modeling of stationary transurethral ultrasound exposures performed with a five element planar applicator (size of each element: 4 × 5mm2). Acoustic power and frequency dependence of the minimum and maximum treatable prostate radii (homogeneous treatment).
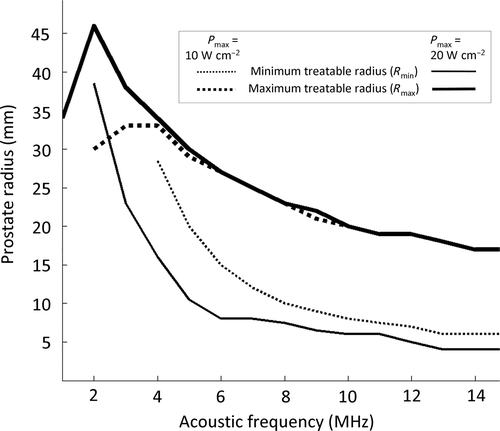
Figure 3. Simulations of stationary ultrasound heating with maximum acoustic power set to Pmax = 20 W cm−2. (a) Frequency dependency of the minimum treatable prostate radius; (b) Treatment radius as a function of time and frequency dependency of the maximum treatment radius; (c) Crossover radius for treatment optimization. Definition of the optimal range of prostate radii for a dual-frequency couple composed of fundamental and 3rd harmonic frequencies.

Table V. Treatable prostate radii during stationary ultrasound heating as a function of power and frequency. Maximum temperature and ultrasound exposure time associated with the maximum treatable radii.
Figure 4. Effects of acoustic frequency and power on transurethral prostate treatment outcomes. Modeling of the maximum temperature distribution calculated for a central plane in 2 prostate glands treated under different conditions. (a) f = 8 MHz, Pmax = 10 W cm−2, (b) f = 8 MHz, Pmax = 20 W cm−2, (c) f = 4 MHz, Pmax = 10 W cm−2, (d) f = 4 MHz, Pmax = 20 W cm−2.
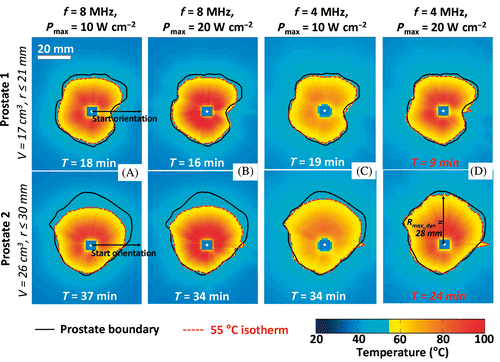
Table VI. Single frequency treatment outcomes. Comparison between f = 8 MHz and f = 4 MHz, Pmax = 10 W cm−2 and Pmax = 20 W cm−2.
Figure 5. Analysis of ultrasound powers and frequencies for full canine prostate treatment. (a) Undertreated volume as a function of frequency; (b) Treatment time as a function of frequency for different powers. Appropriate choice of power/frequency enables decreasing undertreatment while reducing treatment time. Full treatment was defined when at least 95% of the total prostate volume exceeded 55°C. At Pmax = 20 W cm−2, f = 3–5 MHz, the average total undertreatment and the average treatment time reach minima. These parameters achieved full treatment in 8 of the 9 prostates. Reduced performance and extended treatment times were observed for frequencies above and below this range.
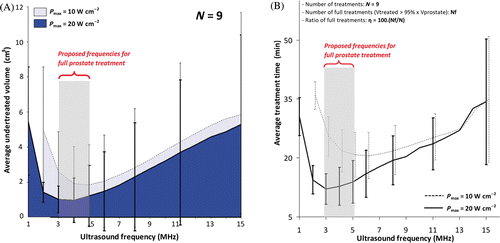
Figure 6. Pre-tuning and simulations of the rotation rate for a transurethral ultrasound device during full canine prostate treatment performed at high surface acoustic power. History of the controller chosen parameters during the rotation of the device as a function of the prostate radii faced by the transducers. (a) Single-frequency exposure at 2 MHz; (b) Frequency couple 2/6 MHz: treatments tuned at 6 MHz were faster than at 2 MHz for the entire range of radii studied. No crossover radius could be determined based on the tuning. (c) Single-frequency exposure at 4 MHz; (d) Dual-frequency exposure at 4/12 MHz: a cross-section between the tuning curves occurred in the range of radii studied and led to a crossover radius Rco of 18 mm.
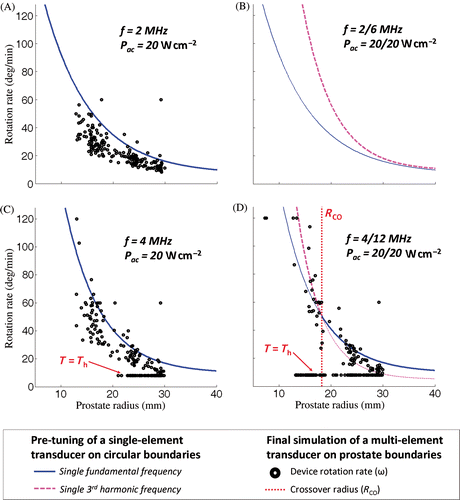
Table VII. Comparison between single frequency and dual frequency simulated treatments. Highlighted in grey are the configurations evaluated experimentally. All provided values are averaged over nine different treatments simulated with nine canine prostate boundaries.
Figure 7. Comparison between single- and dual-frequency treatments in gel phantoms for 2 different slices. (a) Single 4.05 MHz high power (20 W cm−2) showing the maximum temperature reached during the treatment in 2 different slices of the segmented canine prostate profile, respectively the middle and base slices; (b) Dual 4.05/13.10 MHz mixed power (20/10 W cm−2) ultrasound exposures with a crossover radius set at 12 mm; (c) Temperature profiles along the dash dot lines shown in (a) and (b). Use of the higher frequency during rotational ultrasound exposures creates a steeper temperature gradient beyond the target boundary.
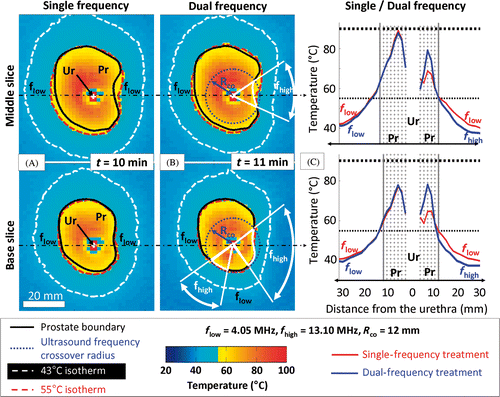
Table VIII. Dual frequency mixed power treatment outcomes during gel phantom experiments in 3 different canine prostates.