1,704
Views
29
CrossRef citations to date
0
Altmetric
Research Article

Chemical inducers of heat shock proteins derived from medicinal plants and cytoprotective genes response

, , , , , , , & show all
Pages 1-8 | Received 30 Jun 2011, Accepted 23 Sep 2011, Published online: 11 Jan 2012

Figures & data

Table I. List of 80 chemical compounds that were examined for their Hsp70 inducing ability.

Figure 1. (A) Chemical structure of shikonin. (B) Bands of Hsp70 induced by five active compounds at 1µM concentration were quantified by densitometry and normalised with β-actin. Hyperthermia (HT) 44°C for 15 min was used as a positive control. Bars indicate standard deviation (n = 3).
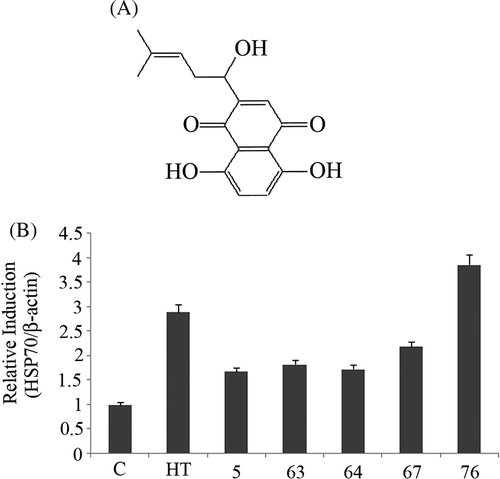
Figure 1. (A) Chemical structure of shikonin. (B) Bands of Hsp70 induced by five active compounds at 1µM concentration were quantified by densitometry and normalised with β-actin. Hyperthermia (HT) 44°C for 15 min was used as a positive control. Bars indicate standard deviation (n = 3).

Figure 2. (A) U937 cells were treated with shikonin concentration-dependently for 6 h followed by assessment of early apoptosis (black bar) and secondary necrosis (grey bar) by flow cytometry. Bars indicate standard deviation (n = 3). (B) Cell survival assay was performed with 0.01, 0.1 and 1 µM concentrations of shikonin. After 6 h incubation WST-8 reagent was added to each well. Bars indicate standard deviation (n = 3).
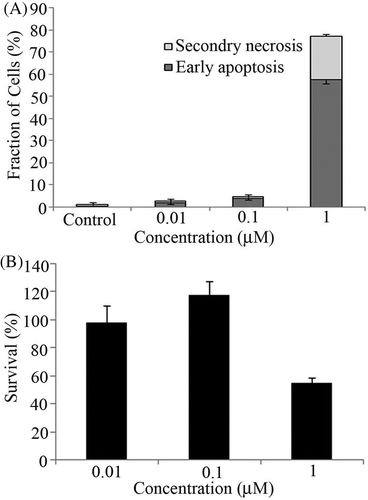
Figure 2. (A) U937 cells were treated with shikonin concentration-dependently for 6 h followed by assessment of early apoptosis (black bar) and secondary necrosis (grey bar) by flow cytometry. Bars indicate standard deviation (n = 3). (B) Cell survival assay was performed with 0.01, 0.1 and 1 µM concentrations of shikonin. After 6 h incubation WST-8 reagent was added to each well. Bars indicate standard deviation (n = 3).

Figure 3. (A) U937 cells were first incubated with DCFH-DA for 30 min and then treated with shikonin in a time-dependent manner. Intracellular peroxides level was measured by flow cytometry. (B) Concentration and time-dependent induction of Hsp70 was measured by western blotting. Hyperthermia (HT) 44°C for 15 min was used as a positive control. (C) Bands were quantified by densitometry and normalised with β-actin. Bars indicate standard deviation (n = 3). (D) HSF1 phosphorylation was measured time-dependently by western blotting. Hyperthermia (HT) 44°C for 15 min was used as a positive control.
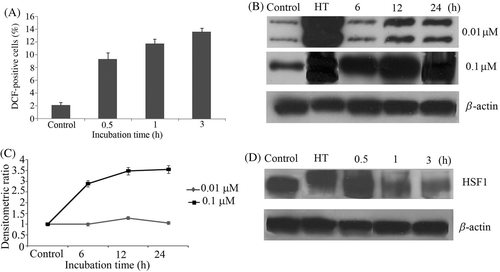
Figure 3. (A) U937 cells were first incubated with DCFH-DA for 30 min and then treated with shikonin in a time-dependent manner. Intracellular peroxides level was measured by flow cytometry. (B) Concentration and time-dependent induction of Hsp70 was measured by western blotting. Hyperthermia (HT) 44°C for 15 min was used as a positive control. (C) Bands were quantified by densitometry and normalised with β-actin. Bars indicate standard deviation (n = 3). (D) HSF1 phosphorylation was measured time-dependently by western blotting. Hyperthermia (HT) 44°C for 15 min was used as a positive control.

Figure 4. A gene network including up-regulated genes. Cells were treated with the compound and cultured at 37°C for 3 h. Gene chip analysis was performed. Genes that were up-regulated were analysed using Ingenuity Pathways Analysis tools. The network is displayed graphically as nodes (genes or protein group) and edges (the biological relationships between the nodes). The node colour of genes indicated the expression level of genes. Nodes and edges are displayed in various shapes and labels that present the functional class of genes and the nature of the relationship between the nodes, respectively.
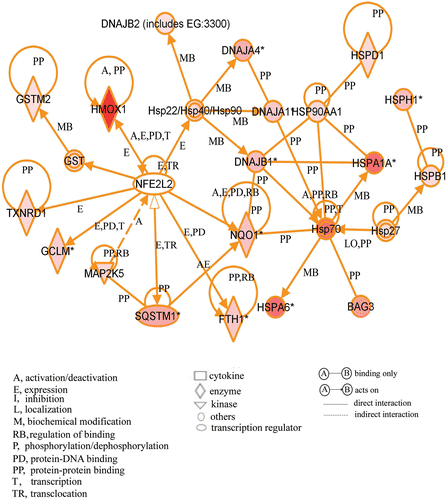
Figure 4. A gene network including up-regulated genes. Cells were treated with the compound and cultured at 37°C for 3 h. Gene chip analysis was performed. Genes that were up-regulated were analysed using Ingenuity Pathways Analysis tools. The network is displayed graphically as nodes (genes or protein group) and edges (the biological relationships between the nodes). The node colour of genes indicated the expression level of genes. Nodes and edges are displayed in various shapes and labels that present the functional class of genes and the nature of the relationship between the nodes, respectively.

Figure 5. Verification of microarray results by qPCR assay. Cells were treated with 0.1 µM shikonin time-dependently and then real-time qPCR assay was performed. (A) HMOX1 (heme oxygenase (decycling) 1) (B) NQO1 (NAD(P)H dehydrogenase, quinone 1) (C) HSPA6 (heat shock 70 kDa protein 6) (D) DNAJA1(DnaJ (Hsp40) homologue, subfamily A, member 1). Each mRNA expression level was normalised with GADPH. Data are presented as mean ± SD (n = 3).
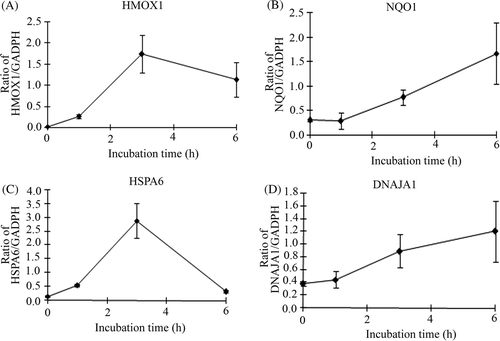
Figure 5. Verification of microarray results by qPCR assay. Cells were treated with 0.1 µM shikonin time-dependently and then real-time qPCR assay was performed. (A) HMOX1 (heme oxygenase (decycling) 1) (B) NQO1 (NAD(P)H dehydrogenase, quinone 1) (C) HSPA6 (heat shock 70 kDa protein 6) (D) DNAJA1(DnaJ (Hsp40) homologue, subfamily A, member 1). Each mRNA expression level was normalised with GADPH. Data are presented as mean ± SD (n = 3).

Reprints and Corporate Permissions

Please note: Selecting permissions does not provide access to the full text of the article, please see our help page How do I view content?

To request a reprint or corporate permissions for this article, please click on the relevant link below:

Academic Permissions

Please note: Selecting permissions does not provide access to the full text of the article, please see our help page How do I view content?

Obtain permissions instantly via Rightslink by clicking on the button below:

If you are unable to obtain permissions via Rightslink, please complete and submit this Permissions form. For more information, please visit our Permissions help page.