1,203
Views
60
CrossRef citations to date
0
Altmetric
Research Article

Considerations for theoretical modelling of thermal ablation with catheter-based ultrasonic sources: Implications for treatment planning, monitoring and control

&
Pages 69-86 | Received 17 Dec 2010, Accepted 05 Oct 2011, Published online: 11 Jan 2012

Figures & data

Figure 1. Catheter-based ultrasound applicators with tubular transducer segments for thermal ablation: (top) 2.4 mm OD applicator suitable for interstitial or percutaneous ablation of prostate and liver targets; (bottom) 10 mm OD transurethral applicator for ablation of prostate targets. Transducers may be modified to sonicate in 90°, 180°, or 270° sectors of the angular expanse, or left unmodified for 360° sonication. (Not to scale.)
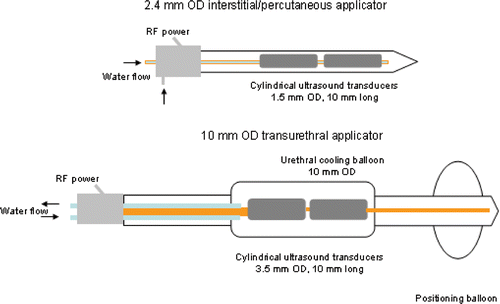
Figure 1. Catheter-based ultrasound applicators with tubular transducer segments for thermal ablation: (top) 2.4 mm OD applicator suitable for interstitial or percutaneous ablation of prostate and liver targets; (bottom) 10 mm OD transurethral applicator for ablation of prostate targets. Transducers may be modified to sonicate in 90°, 180°, or 270° sectors of the angular expanse, or left unmodified for 360° sonication. (Not to scale.)

Table I.  Nominal values for tissue physical properties and model parameters.

Figure 2. (A) Acoustic attenuation coefficient, α = kα α0, increases linearly with the logarithm of thermal dose, t43, as described in Citation31 and employed in models 1–3. (B) Blood mass perfusion rate , varies as a function of degree of vascular stasis, computed using an Arrhenius model, as described in Citation29 and Citation37 and employed in model 1.
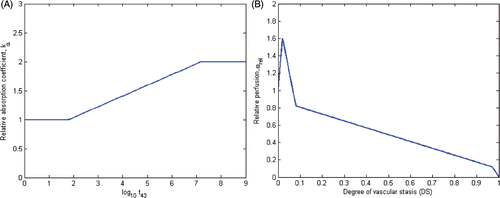
Figure 2. (A) Acoustic attenuation coefficient, α = kα α0, increases linearly with the logarithm of thermal dose, t43, as described in Citation31 and employed in models 1–3. (B) Blood mass perfusion rate , varies as a function of degree of vascular stasis, computed using an Arrhenius model, as described in Citation29 and Citation37 and employed in model 1.

Table II.  Complex tissue models for dynamic changes of acoustic attenuation/absorption coefficients and blood perfusion rate during thermal ablation.

Figure 3. Radial depth of ablation zone after 15 min ablations in prostate and liver targets using interstitial applicators as predicted by thermal dose (t43) and thermal damage (Ω1 uses Arrhenius parameters reported in Citation66 and Ω2 uses parameters reported in Citation70) indicators. Error bars indicate ranges computed using higher (5 kg m−3 s−1 in prostate, 20 kg m−3 s−1 in liver) and lower (1 kg m−3 s−1 and 10 kg m−3 s−1) values for the nominal (2.5 kg m−3 s−1 in prostate, 15 kg m−3 s−1 in liver) blood perfusion rate. (A) 90° applicator in prostate, (B) 180° applicator in prostate, (C) 360° applicator in prostate, (D) 360° applicator in liver.
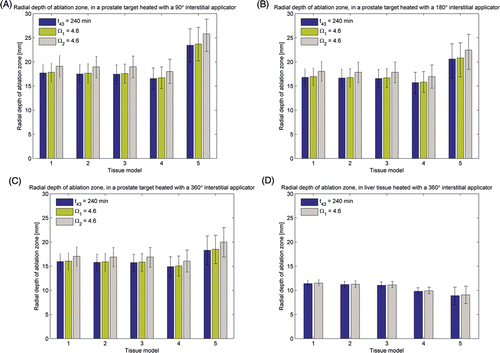
Figure 3. Radial depth of ablation zone after 15 min ablations in prostate and liver targets using interstitial applicators as predicted by thermal dose (t43) and thermal damage (Ω1 uses Arrhenius parameters reported in Citation66 and Ω2 uses parameters reported in Citation70) indicators. Error bars indicate ranges computed using higher (5 kg m−3 s−1 in prostate, 20 kg m−3 s−1 in liver) and lower (1 kg m−3 s−1 and 10 kg m−3 s−1) values for the nominal (2.5 kg m−3 s−1 in prostate, 15 kg m−3 s−1 in liver) blood perfusion rate. (A) 90° applicator in prostate, (B) 180° applicator in prostate, (C) 360° applicator in prostate, (D) 360° applicator in liver.

Figure 4. (A) Radial depth of ablation zone after 15 min prostate ablations with a 90° transurethral applicator, as predicted by thermal dose (t43) and thermal damage (Ω1 uses Arrhenius parameters reported in Citation66 and Ω2 uses parameters reported in Citation70) indicators. (B) Radial depth of the ablation zone as indicated by temperature, thermal dose (t43) and thermal damage (Ω1 and Ω2) thresholds, over the course of a 15 min ablation with a 90° transurethral applicator in prostate and liver tissue.
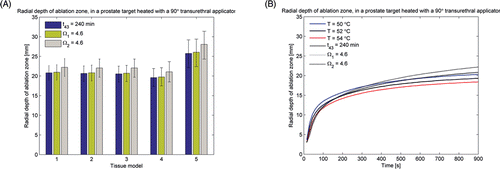
Figure 4. (A) Radial depth of ablation zone after 15 min prostate ablations with a 90° transurethral applicator, as predicted by thermal dose (t43) and thermal damage (Ω1 uses Arrhenius parameters reported in Citation66 and Ω2 uses parameters reported in Citation70) indicators. (B) Radial depth of the ablation zone as indicated by temperature, thermal dose (t43) and thermal damage (Ω1 and Ω2) thresholds, over the course of a 15 min ablation with a 90° transurethral applicator in prostate and liver tissue.

Table III.  Volume (cm3) of the ablation zone as indicated by thermal dose (t43 ≥ 240 min) and thermal damage measures (Ω ≥ 4.6) after 5, 10 and 15 min ablation with interstitial and transurethral applicators in prostate and liver tissue, computed using tissue models 1–5. Values listed in the table are for a nominal perfusion rate (2.5 kg m−3 s−1 for prostate and 15 kg m−3 s−1 for liver), while values in parentheses are for lower and higher perfusion rates, as listed in the text.

Figure 5. Radial depth of the extents of thermal toxicity, as indicated by T = 43°C isotherm, after 5–15 min thermal ablations with a 180° interstitial applicator in prostate target, simulated using tissue models 1–5.
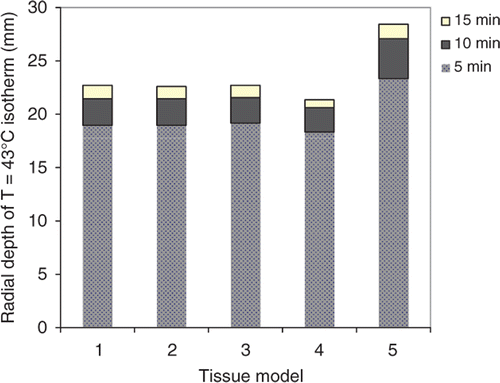
Figure 5. Radial depth of the extents of thermal toxicity, as indicated by T = 43°C isotherm, after 5–15 min thermal ablations with a 180° interstitial applicator in prostate target, simulated using tissue models 1–5.

Figure 6. (A) Transient evolution of maximum tissue temperature during 15 min ablations (with and without feedback control) using a 180° interstitial applicator in a prostate target. (B) Transient evolution of power applied to a 180° ultrasound sector as determined by the control algorithm simulated using tissue models 1–5.
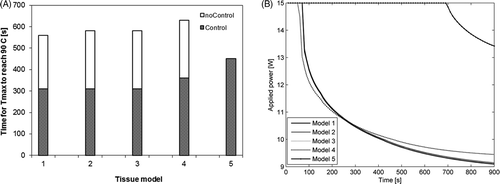
Figure 6. (A) Transient evolution of maximum tissue temperature during 15 min ablations (with and without feedback control) using a 180° interstitial applicator in a prostate target. (B) Transient evolution of power applied to a 180° ultrasound sector as determined by the control algorithm simulated using tissue models 1–5.

Figure 7. Radial depth of the ablation zone as indicated by temperature, thermal dose (t43) and thermal damage (Ω1 and Ω2) thresholds, over the course of a 15 min ablation with interstitial applicators in prostate and liver tissue. (A) 360° applicator in prostate, (B) 180° applicator in prostate, (C) 90° applicator prostate, (D) 360° applicator in liver.
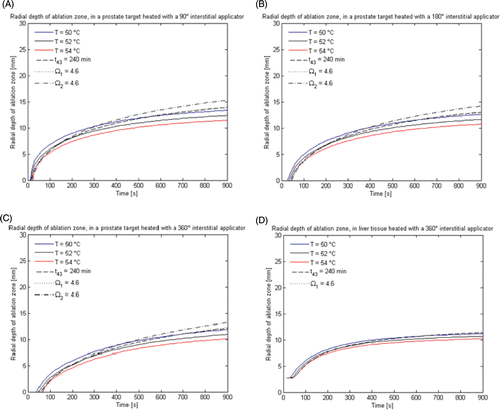
Figure 7. Radial depth of the ablation zone as indicated by temperature, thermal dose (t43) and thermal damage (Ω1 and Ω2) thresholds, over the course of a 15 min ablation with interstitial applicators in prostate and liver tissue. (A) 360° applicator in prostate, (B) 180° applicator in prostate, (C) 90° applicator prostate, (D) 360° applicator in liver.

Figure 8. Patient-specific treatment simulation and plan for targeting prostate cancer in the posterior gland using a directional (90°) interstitial ultrasound applicator implanted in the peripheral gland and directed toward the urethra. (A) Thermal damage (Ω ≥ 4.6) and temperature (T ≥ 52°C) isosurfaces indicating coagulative necrosis. (B) Thermal dose (t43 ≥ 240 min) and temperature (T ≥ 52°C) isosurfaces indicating coagulative necrosis. (C) Temperature map in axial slice through the centre of the applicator with critical temperature, thermal dose and thermal damage contours overlaid.
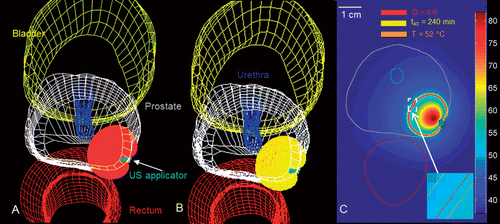
Figure 8. Patient-specific treatment simulation and plan for targeting prostate cancer in the posterior gland using a directional (90°) interstitial ultrasound applicator implanted in the peripheral gland and directed toward the urethra. (A) Thermal damage (Ω ≥ 4.6) and temperature (T ≥ 52°C) isosurfaces indicating coagulative necrosis. (B) Thermal dose (t43 ≥ 240 min) and temperature (T ≥ 52°C) isosurfaces indicating coagulative necrosis. (C) Temperature map in axial slice through the centre of the applicator with critical temperature, thermal dose and thermal damage contours overlaid.

Figure 9. Patient-specific treatment simulation and plan for targeting focal prostate cancer in the posterior gland using a directional (90°) transurethral ultrasound applicator directing energy toward the periphery. (A) Thermal damage (Ω ≥ 4.6) and temperature (T ≥ 52°C) isosurfaces indicating coagulative necrosis. (B) Thermal dose (t43 ≥ 240 min) and temperature (T ≥ 52°C) isosurfaces indicating coagulative necrosis. (C) Temperature map in axial slice through the centre of the applicator with critical temperature, thermal dose, and thermal damage contours overlaid.
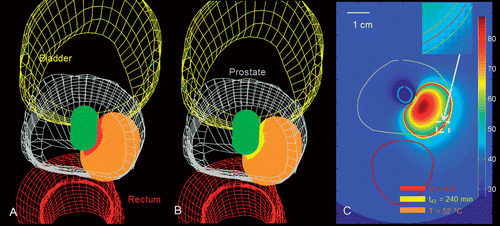
Figure 9. Patient-specific treatment simulation and plan for targeting focal prostate cancer in the posterior gland using a directional (90°) transurethral ultrasound applicator directing energy toward the periphery. (A) Thermal damage (Ω ≥ 4.6) and temperature (T ≥ 52°C) isosurfaces indicating coagulative necrosis. (B) Thermal dose (t43 ≥ 240 min) and temperature (T ≥ 52°C) isosurfaces indicating coagulative necrosis. (C) Temperature map in axial slice through the centre of the applicator with critical temperature, thermal dose, and thermal damage contours overlaid.

Figure 10. Simulated temperature, thermal dose (t43), and thermal damage (Ω) profiles after 15 min ablation with a 180° interstitial applicator in prostate tissue, showing sharp fall off of thermal dose and thermal damage profiles in regions close to the boundary of the ablation zone.
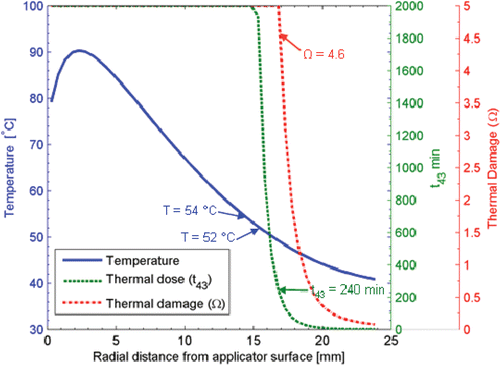
Figure 10. Simulated temperature, thermal dose (t43), and thermal damage (Ω) profiles after 15 min ablation with a 180° interstitial applicator in prostate tissue, showing sharp fall off of thermal dose and thermal damage profiles in regions close to the boundary of the ablation zone.

Reprints and Corporate Permissions

Please note: Selecting permissions does not provide access to the full text of the article, please see our help page How do I view content?

To request a reprint or corporate permissions for this article, please click on the relevant link below:

Academic Permissions

Please note: Selecting permissions does not provide access to the full text of the article, please see our help page How do I view content?

Obtain permissions instantly via Rightslink by clicking on the button below:

If you are unable to obtain permissions via Rightslink, please complete and submit this Permissions form. For more information, please visit our Permissions help page.